
Price-to-Sales Below 1 in Canada: 8.71% CAGR, +3.63% vs TSX Composite Over 25 Years
A quality-filtered P/S value screen on the TSX returned 8.71% annually vs 5.08% for the TSX Composite, with zero cash periods across 25 years and an average of 26.2 stocks per quarter. Sharpe 0.325, max drawdown -44.67%.

We ran a P/S value screen on the TSX from 2000 to 2025. The strategy requires P/S below 1.0, gross margin above 20%, operating margin above 5%, and ROE above 10%. It returned 8.71% annually vs 5.08% for the TSX Composite, with zero cash periods across 25 years and an average of 26.2 stocks per quarter.
Contents
- Method
- What Is the P/S Screen?
- The Screen
- P/S Value Screen for TSX (SQL)
- What We Found
- 25 years. 3.63% vs TSX Composite. Never ran out of stocks.
- Year-by-year returns
- 2000-2005: the strategy's defining run
- 2015: the oil crash hits hard
- 2016: the recovery year
- 2022-2025: closing strong
- Backtest Methodology
- Limitations
- Takeaway
- Part of a Series
- References
- Run This Screen Yourself
Data: FMP financial data warehouse, 2000–2025. Updated March 2026.
Method
Data source: Ceta Research (FMP financial data warehouse) Universe: TSX, market cap > CAD 500M Period: 2000-2025 (25 years, 100 quarterly periods) Rebalancing: Quarterly (January, April, July, October), equal weight, top 30 by lowest P/S Benchmark: TSX Composite Total Return Cash rule: Hold cash if fewer than 10 stocks qualify
Financial data sourced from financial_ratios (FY) for P/S ratio and margins, key_metrics (FY) for ROE and market cap. 45-day lag on all financial statements to prevent look-ahead bias.
What Is the P/S Screen?
Price-to-sales divides a company's market cap by its annual revenue. A ratio below 1.0 means you're paying less than $1 for every $1 of sales the business generates. Kenneth Fisher popularized P/S as a valuation metric in Super Stocks (1984), arguing it was a cleaner signal than P/E because revenue is harder to manipulate than earnings.
The screen doesn't stop at P/S < 1.0. Without quality filters, that criterion fills the portfolio with commodity traders, fuel distributors, and pipeline companies that run thin margins by design. The quality gates change what qualifies.
Valuation:
| Criterion | Metric | Threshold |
|---|---|---|
| Cheap on sales | Price-to-Sales (FY) | < 1.0 |
Quality Filters:
| Criterion | Metric | Threshold |
|---|---|---|
| Margin quality | Gross Margin | > 20% |
| Operational efficiency | Operating Margin | > 5% |
| Capital returns | Return on Equity | > 10% |
Size:
| Criterion | Metric | Threshold |
|---|---|---|
| Institutional grade | Market Cap | > CAD 500M |
Stocks must pass all four to enter. The top 30 by lowest P/S ratio are selected each quarter, equal weighted.
The Screen
P/S Value Screen for TSX (SQL)
SELECT
    f.symbol,
    p.companyName,
    p.exchange,
    p.sector,
    ROUND(f.priceToSalesRatioTTM, 3) AS ps_ratio,
    ROUND(f.grossProfitMarginTTM * 100, 1) AS gross_margin_pct,
    ROUND(f.operatingProfitMarginTTM * 100, 1) AS op_margin_pct,
    ROUND(k.returnOnEquityTTM * 100, 1) AS roe_pct,
    ROUND(k.marketCap / 1e9, 2) AS mktcap_b
FROM financial_ratios_ttm f
JOIN key_metrics_ttm k ON f.symbol = k.symbol
JOIN profile p ON f.symbol = p.symbol
WHERE f.priceToSalesRatioTTM > 0
  AND f.priceToSalesRatioTTM < 1
  AND f.grossProfitMarginTTM > 0.20
  AND f.operatingProfitMarginTTM > 0.05
  AND k.returnOnEquityTTM > 0.10
  AND k.marketCap > 500000000
  AND p.exchange IN ('TSX')
QUALIFY ROW_NUMBER() OVER (PARTITION BY f.symbol ORDER BY f.priceToSalesRatioTTM ASC) = 1
ORDER BY f.priceToSalesRatioTTM ASC
LIMIT 30
Run this query on Ceta Research
What We Found
25 years. 3.63% vs TSX Composite. Never ran out of stocks.
| Metric | P/S Screen (TSX) | TSX Comp |
|---|---|---|
| CAGR | 8.71% | 5.08% |
| Excess vs TSX | +3.63% | — |
| Sharpe Ratio | 0.325 | — |
| Max Drawdown | -44.67% | — |
| Avg Stocks per Period | 26.2 | — |
| Cash Periods | 0 of 100 | — |
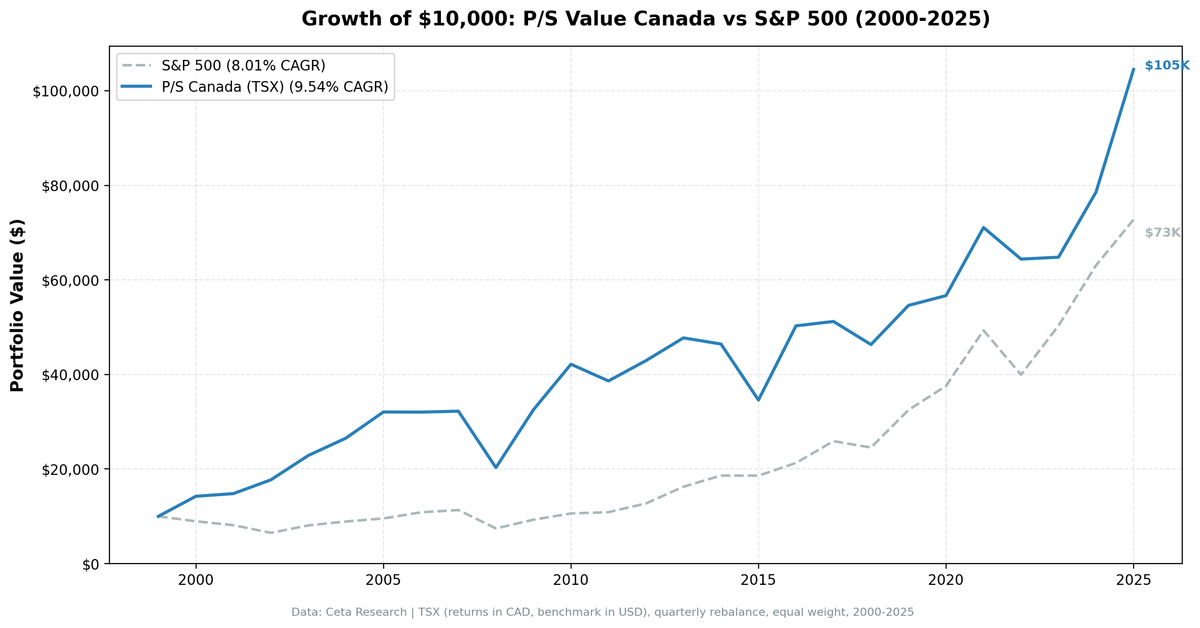
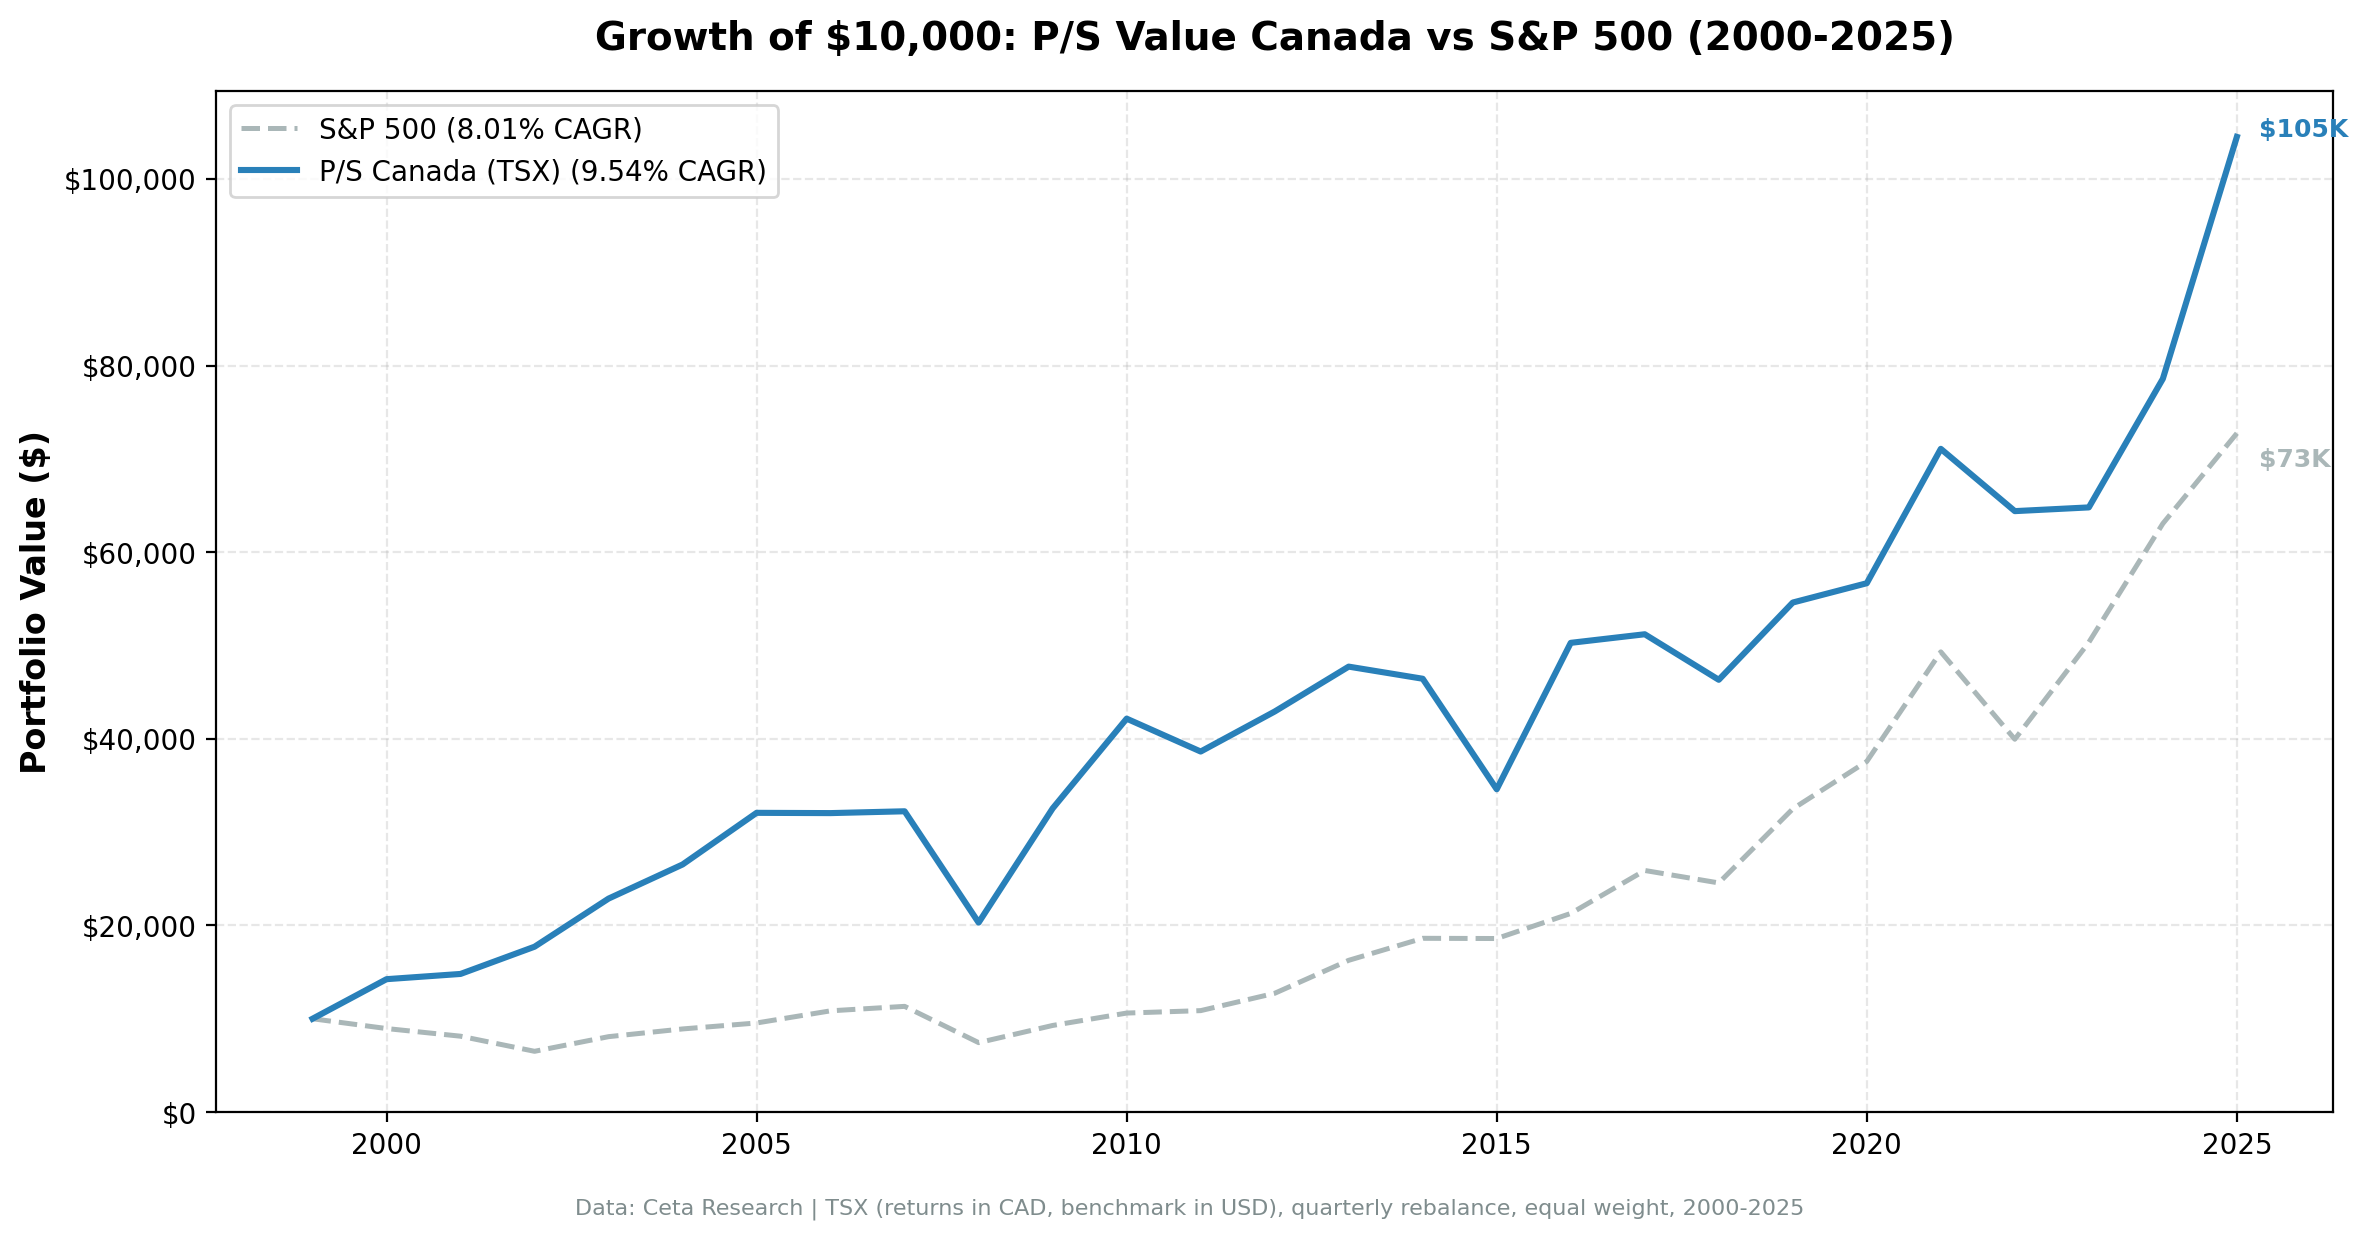
The return is solid: 8.71% annually over 25 years, $10,000 growing to roughly $76,000 in CAD terms. The zero cash periods stand out. The TSX consistently produced enough qualifying stocks through every market condition, including the 2008 credit crisis and the 2015 commodity collapse.
Against the TSX Composite, the case is clearer than it looks against SPY. The TSX returned 5.08% annually over the same period, so the quality-filtered P/S screen added 3.63 percentage points per year. That's a meaningful gap over 25 years. The S&P 500 returned 8.02% (USD), so in raw terms SPY was faster, but that's a cross-currency comparison with different inflation and rate environments. The local comparison against the TSX is the more honest benchmark for a Canadian investor.
The Sharpe of 0.325 reflects real volatility from commodity cycles. It's lower than the US screen's Sharpe, but the excess return over the local benchmark is higher.
Year-by-year returns
| Year | P/S Screen (TSX) | TSX Comp | Excess |
|---|---|---|---|
| 2000 | +44.10% | +2.35% | +41.75% |
| 2001 | +3.20% | -11.20% | +14.40% |
| 2002 | +5.56% | -11.86% | +17.42% |
| 2003 | +21.70% | +23.05% | -1.35% |
| 2004 | +15.03% | +10.24% | +4.79% |
| 2005 | +20.66% | +25.14% | -4.48% |
| 2006 | -0.09% | +12.95% | -13.05% |
| 2007 | +1.05% | +7.76% | -6.71% |
| 2008 | -37.02% | -33.70% | -3.32% |
| 2009 | +60.92% | +28.51% | +32.41% |
| 2010 | +29.88% | +12.94% | +16.94% |
| 2011 | -8.43% | -8.91% | +0.48% |
| 2012 | +11.15% | +2.72% | +8.43% |
| 2013 | +11.08% | +8.40% | +2.68% |
| 2014 | -3.48% | +8.53% | -12.01% |
| 2015 | -25.73% | -12.38% | -13.35% |
| 2016 | +46.87% | +19.15% | +27.72% |
| 2017 | +1.83% | +5.89% | -4.06% |
| 2018 | -9.59% | -12.03% | +2.45% |
| 2019 | +18.12% | +19.19% | -1.07% |
| 2020 | +2.85% | +2.50% | +0.35% |
| 2021 | +24.69% | +21.16% | +3.53% |
| 2022 | -9.41% | -8.44% | -0.97% |
| 2023 | +0.56% | +7.35% | -6.78% |
| 2024 | +21.05% | +19.29% | +1.76% |
| 2025 | +33.30% | +21.14% | +12.16% |
2000-2005: the strategy's defining run
| Period | P/S Screen (TSX) | TSX Comp | Excess |
|---|---|---|---|
| 2000-2002 | +55.1% | -19.6% | +74.7% |
| 2003-2005 | +66.2% | +64.3% | +1.9% |
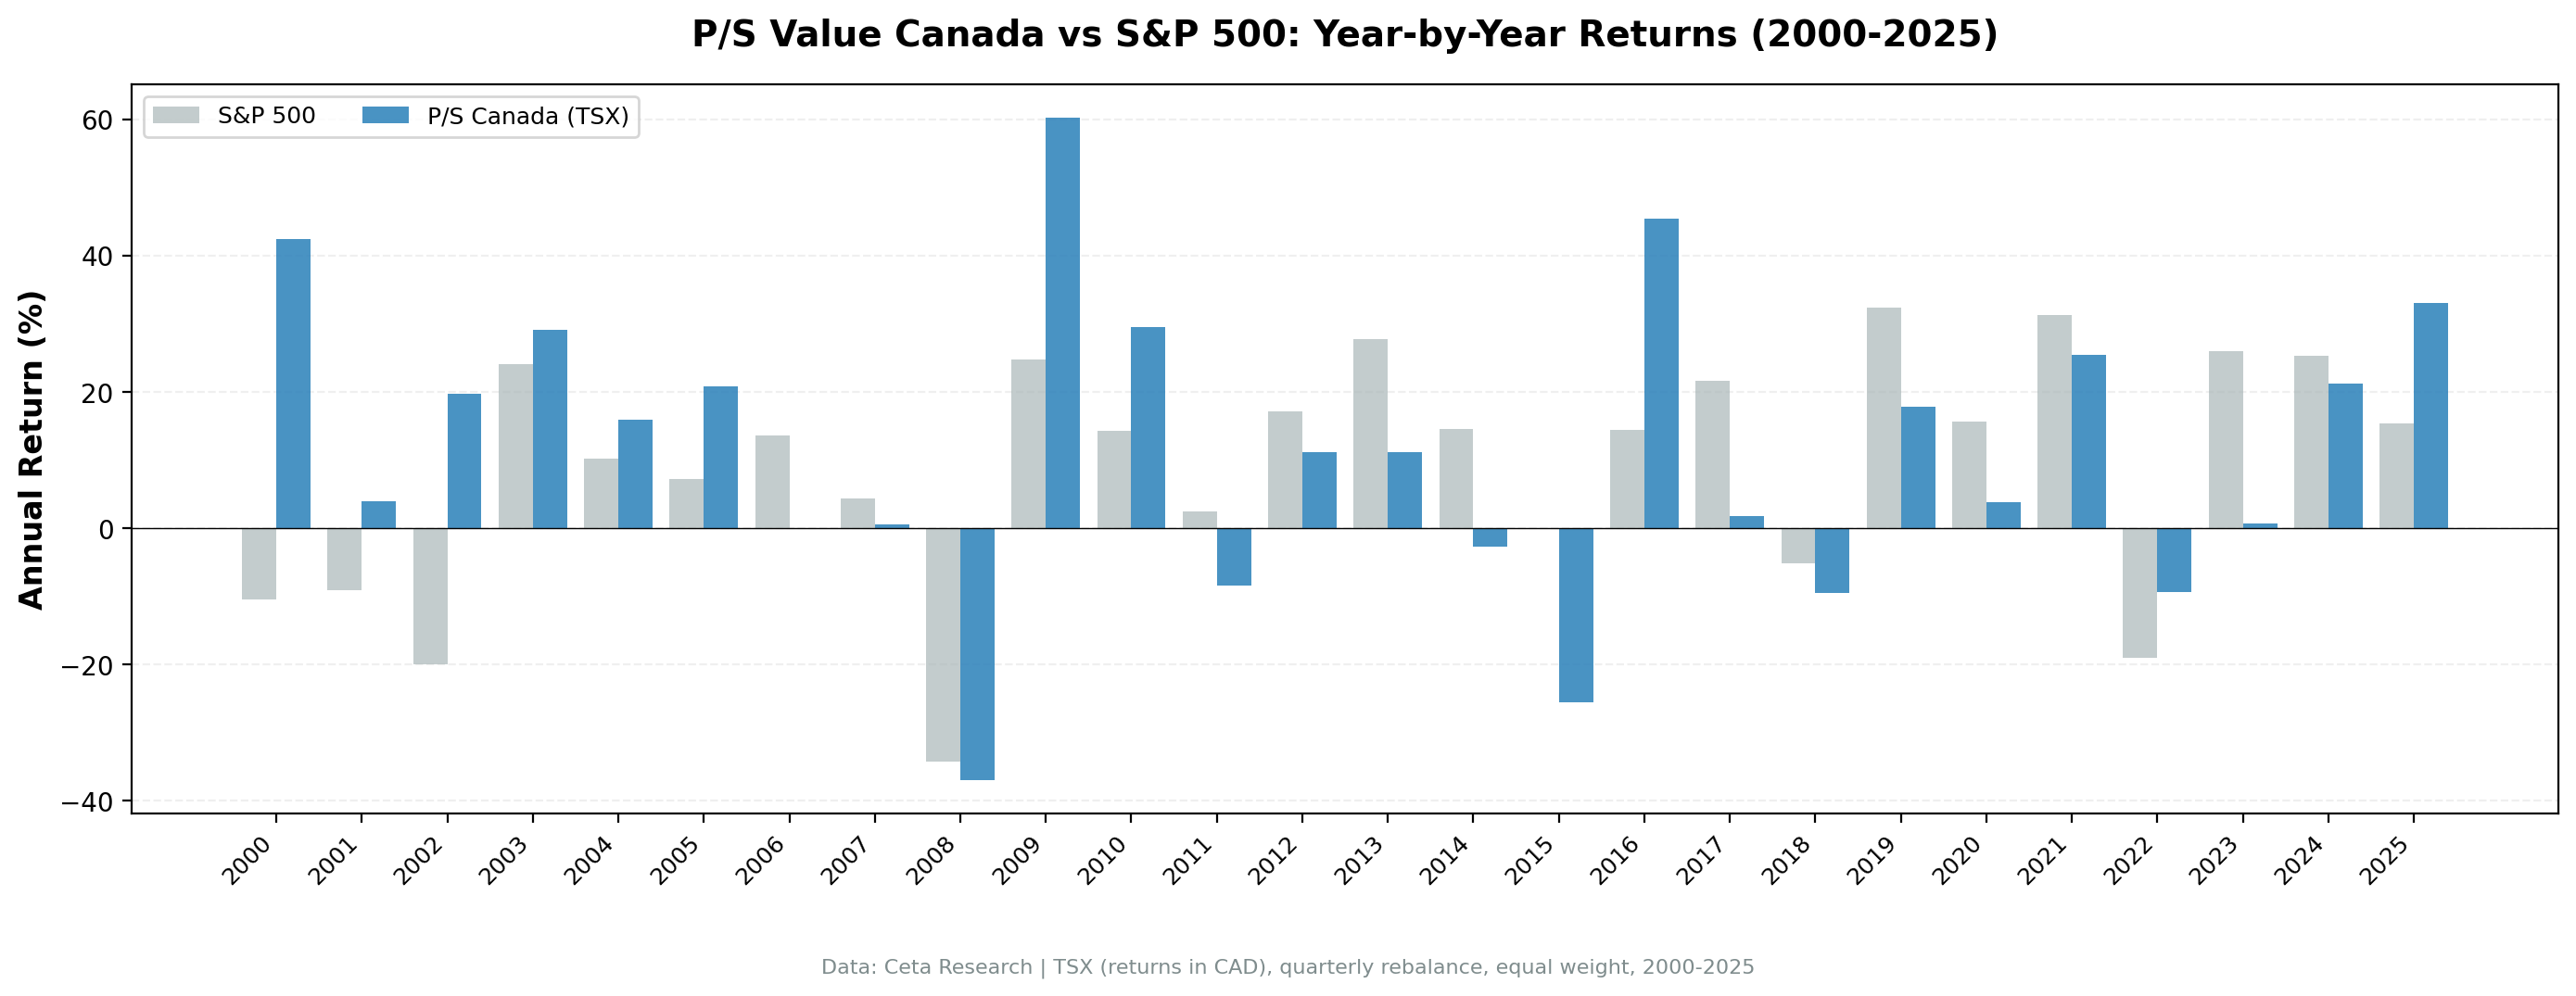
While the US market was deep in the dot-com bust, the TSX screen posted three straight positive years: +44.1%, +3.2%, +5.6%. What's notable is that even the TSX Composite held up relatively well during 2000-2002 (energy and materials kept it afloat), but the quality-filtered P/S screen still beat it by a wide margin. The Canadian large-cap universe had plenty of resource companies at reasonable P/S multiples that kept earning through the tech crash.
When the 2003-2005 recovery came, both the screen and the TSX Composite ran hard. The TSX itself returned 64.3% over those three years, so the comparison is closer than in the US. The screen added modest excess (+21.7%, +15.0%, +20.7%), but the gap over the local benchmark narrowed because Canadian energy and materials re-rated too.
2015: the oil crash hits hard
The worst single year in the backtest was 2015: -25.73%, 13 percentage points worse than the TSX Composite's -12.38%. The oil price collapse explains most of it.
The P/S screen with gross margin > 20% and operating margin > 5% is designed to exclude pure commodity producers. But the TSX's energy and materials sectors include companies, pipeline operators, energy services firms, gold royalty companies, that can pass those margin filters in normal conditions. When oil fell from $100 to $35, those stocks didn't care much about margin filters. They sold off.
The TSX Composite itself fell -12.38% that year, so even the broad index took a hit. The screen's concentration in the qualifying names amplified the loss.
This is the cyclical risk embedded in the TSX. The quality filters help but don't immunize the portfolio from commodity cycles.
2016: the recovery year
After 2015's -25.73%, the portfolio bounced +46.87% in 2016, against the TSX Composite's +19.15%. Oil recovered from its lows, and the beaten-down energy and materials names snapped back hard. The screen outperformed the local benchmark by 27.7 percentage points that year, which is what kept the long-run CAGR positive.
This is the pattern with cyclical strategies: if you stayed in through 2015, the 2016 recovery more than compensated.
2022-2025: closing strong
| Year | P/S Screen (TSX) | TSX Comp | Excess |
|---|---|---|---|
| 2022 | -9.41% | -8.44% | -0.97% |
| 2025 | +33.30% | +21.14% | +12.16% |
2022 was one of the few years the screen tracked close to the TSX Composite rather than beating it sharply. The rising rate environment hurt equities broadly, and the screen didn't provide the same cushion that it did against the US market. The 2025 finish at +33.30% was the second-strongest year in the entire 25-year run, behind only 2009's +60.92%, and beat the TSX by 12 percentage points.
Backtest Methodology
| Parameter | Choice |
|---|---|
| Universe | TSX, Market Cap > CAD 500M |
| Signal | P/S < 1.0, Gross Margin > 20%, Op. Margin > 5%, ROE > 10% |
| Portfolio | Top 30 by lowest P/S, equal weight |
| Rebalancing | Quarterly (January, April, July, October) |
| Cash rule | Hold cash if < 10 qualify |
| Benchmark | TSX Composite Total Return |
| Period | 2000-2025 (25 years, 100 quarterly periods) |
| Data | Point-in-time (45-day lag on FY financial statements) |
Limitations
Commodity-driven cyclicality. The TSX is heavily weighted toward energy, materials, and financials. The quality filters reduce but don't eliminate exposure to commodity cycles. 2015 is the evidence.
Sharpe ratio. 0.325 reflects the commodity-driven volatility in the portfolio. It's lower than some other markets in the global series. The alpha is in the raw return over the local benchmark, not in risk-adjusted efficiency.
Currency effects. Returns are in CAD. US-based investors face an additional layer of CAD/USD currency risk that isn't captured in the backtest.
Sector concentration. Without a sector cap, some quarters skew heavily toward energy services or financials. Single-sector risk exists, especially given the TSX's natural resource bias.
Survivorship bias. Exchange membership uses current profiles, not historical. Delistings and historical composition aren't tracked.
Transaction costs not included. Quarterly rebalancing of 30 stocks generates turnover. Cost drag at 0.2-0.5% per transaction one-way is approximately 0.4-1.0% annually.
Takeaway
The TSX P/S screen delivers 8.71% CAGR over 25 years, 3.63% above the TSX Composite. The zero cash periods show the Canadian market is consistently deep enough to fill the screen. The 2000-2002 run demonstrates the strategy's real strength: holding profitable Canadian companies when the US tech bubble was deflating and when even the TSX Composite struggled.
The cyclical risk is real. The TSX leans into energy and materials in ways US screens don't, and 2015 was painful. But the 2016 recovery was bigger. Over 25 years the math holds.
Compared against SPY (8.02% USD), the gap narrows. That's a cross-currency comparison with different rate environments, and the fair comparison for a Canadian investor is against the local benchmark. On that basis, 3.63% annual excess over 25 years is a clear result.
This isn't a risk-reduction strategy. It's a return-enhancement strategy that asks you to tolerate commodity cycle volatility. For an investor who understands that, the 25-year track record is a reasonable case.
Part of a Series
This analysis is part of our global P/S value screen comparison. We tested the same screen across multiple exchanges worldwide: - P/S Value Screen on US Stocks (NYSE + NASDAQ + AMEX) - 11.10% CAGR, strongest raw return - P/S Value Screen on Indian Stocks (BSE + NSE) - P/S Value Screen on German Stocks (XETRA) - P/S Value Screen on Swedish Stocks (STO) - P/S Value Screen on South African Stocks (JNB) - P/S Value Screen on Japanese Stocks (JPX) - P/S Value Screen: Global Exchange Comparison
References
- Fisher, K. (1984). Super Stocks. Dow Jones-Irwin.
- Barbee, W., Mukherji, S. & Raines, G. (1996). "Do Sales-Price and Debt-Equity Explain Stock Returns Better than Book-Market and Firm Size?" Financial Analysts Journal, 52(2), 56-60.
- Gray, W. & Vogel, J. (2012). "Analyzing Valuation Measures: A Performance Horse-Race over the Past 40 Years." Journal of Portfolio Management, 39(1), 112-121.
- Novy-Marx, R. (2013). "The Other Side of Value: The Gross Profitability Premium." Journal of Financial Economics, 108(1), 1-28.
Run This Screen Yourself
Via web UI: Run the P/S value screen on Ceta Research. The query is pre-loaded. Hit "Run" and see what qualifies today.
Via Python:
import requests, time

API_KEY = "your_api_key"  # get one at cetaresearch.com
BASE = "https://tradingstudio.finance/api/v1"

resp = requests.post(f"{BASE}/data-explorer/execute", headers={
    "X-API-Key": API_KEY, "Content-Type": "application/json"
}, json={
    "query": """
        SELECT f.symbol, p.companyName, p.sector,
            ROUND(f.priceToSalesRatioTTM, 3) AS ps_ratio,
            ROUND(f.grossProfitMarginTTM * 100, 1) AS gross_margin_pct,
            ROUND(f.operatingProfitMarginTTM * 100, 1) AS op_margin_pct,
            ROUND(k.returnOnEquityTTM * 100, 1) AS roe_pct,
            ROUND(k.marketCap / 1e9, 2) AS mktcap_b
        FROM financial_ratios_ttm f
        JOIN key_metrics_ttm k ON f.symbol = k.symbol
        JOIN profile p ON f.symbol = p.symbol
        WHERE f.priceToSalesRatioTTM > 0
          AND f.priceToSalesRatioTTM < 1
          AND f.grossProfitMarginTTM > 0.20
          AND f.operatingProfitMarginTTM > 0.05
          AND k.returnOnEquityTTM > 0.10
          AND k.marketCap > 500000000
          AND p.exchange IN ('TSX')
        QUALIFY ROW_NUMBER() OVER (PARTITION BY f.symbol ORDER BY f.priceToSalesRatioTTM ASC) = 1
        ORDER BY f.priceToSalesRatioTTM ASC
        LIMIT 30
    """,
    "options": {"format": "json", "limit": 100}
})
task_id = resp.json()["taskId"]

while True:
    result = requests.get(f"{BASE}/tasks/data-query/{task_id}",
                          headers={"X-API-Key": API_KEY}).json()
    if result["status"] in ("completed", "failed"):
        break
    time.sleep(2)

for r in result["result"]["rows"][:10]:
    print(f"{r['symbol']:8s} P/S={r['ps_ratio']:.3f} GM={r['gross_margin_pct']:.1f}% ROE={r['roe_pct']:.1f}%")
Get your API key at cetaresearch.com. The full backtest code (Python + DuckDB) is on GitHub.
Data: Ceta Research, FMP financial data warehouse. Universe: TSX. Benchmark: TSX Composite Total Return. Returns in CAD. Quarterly rebalance, equal weight, 2000-2025.


