
QARP on Chinese Stocks: Quality Screening in the World's Second-Largest Market
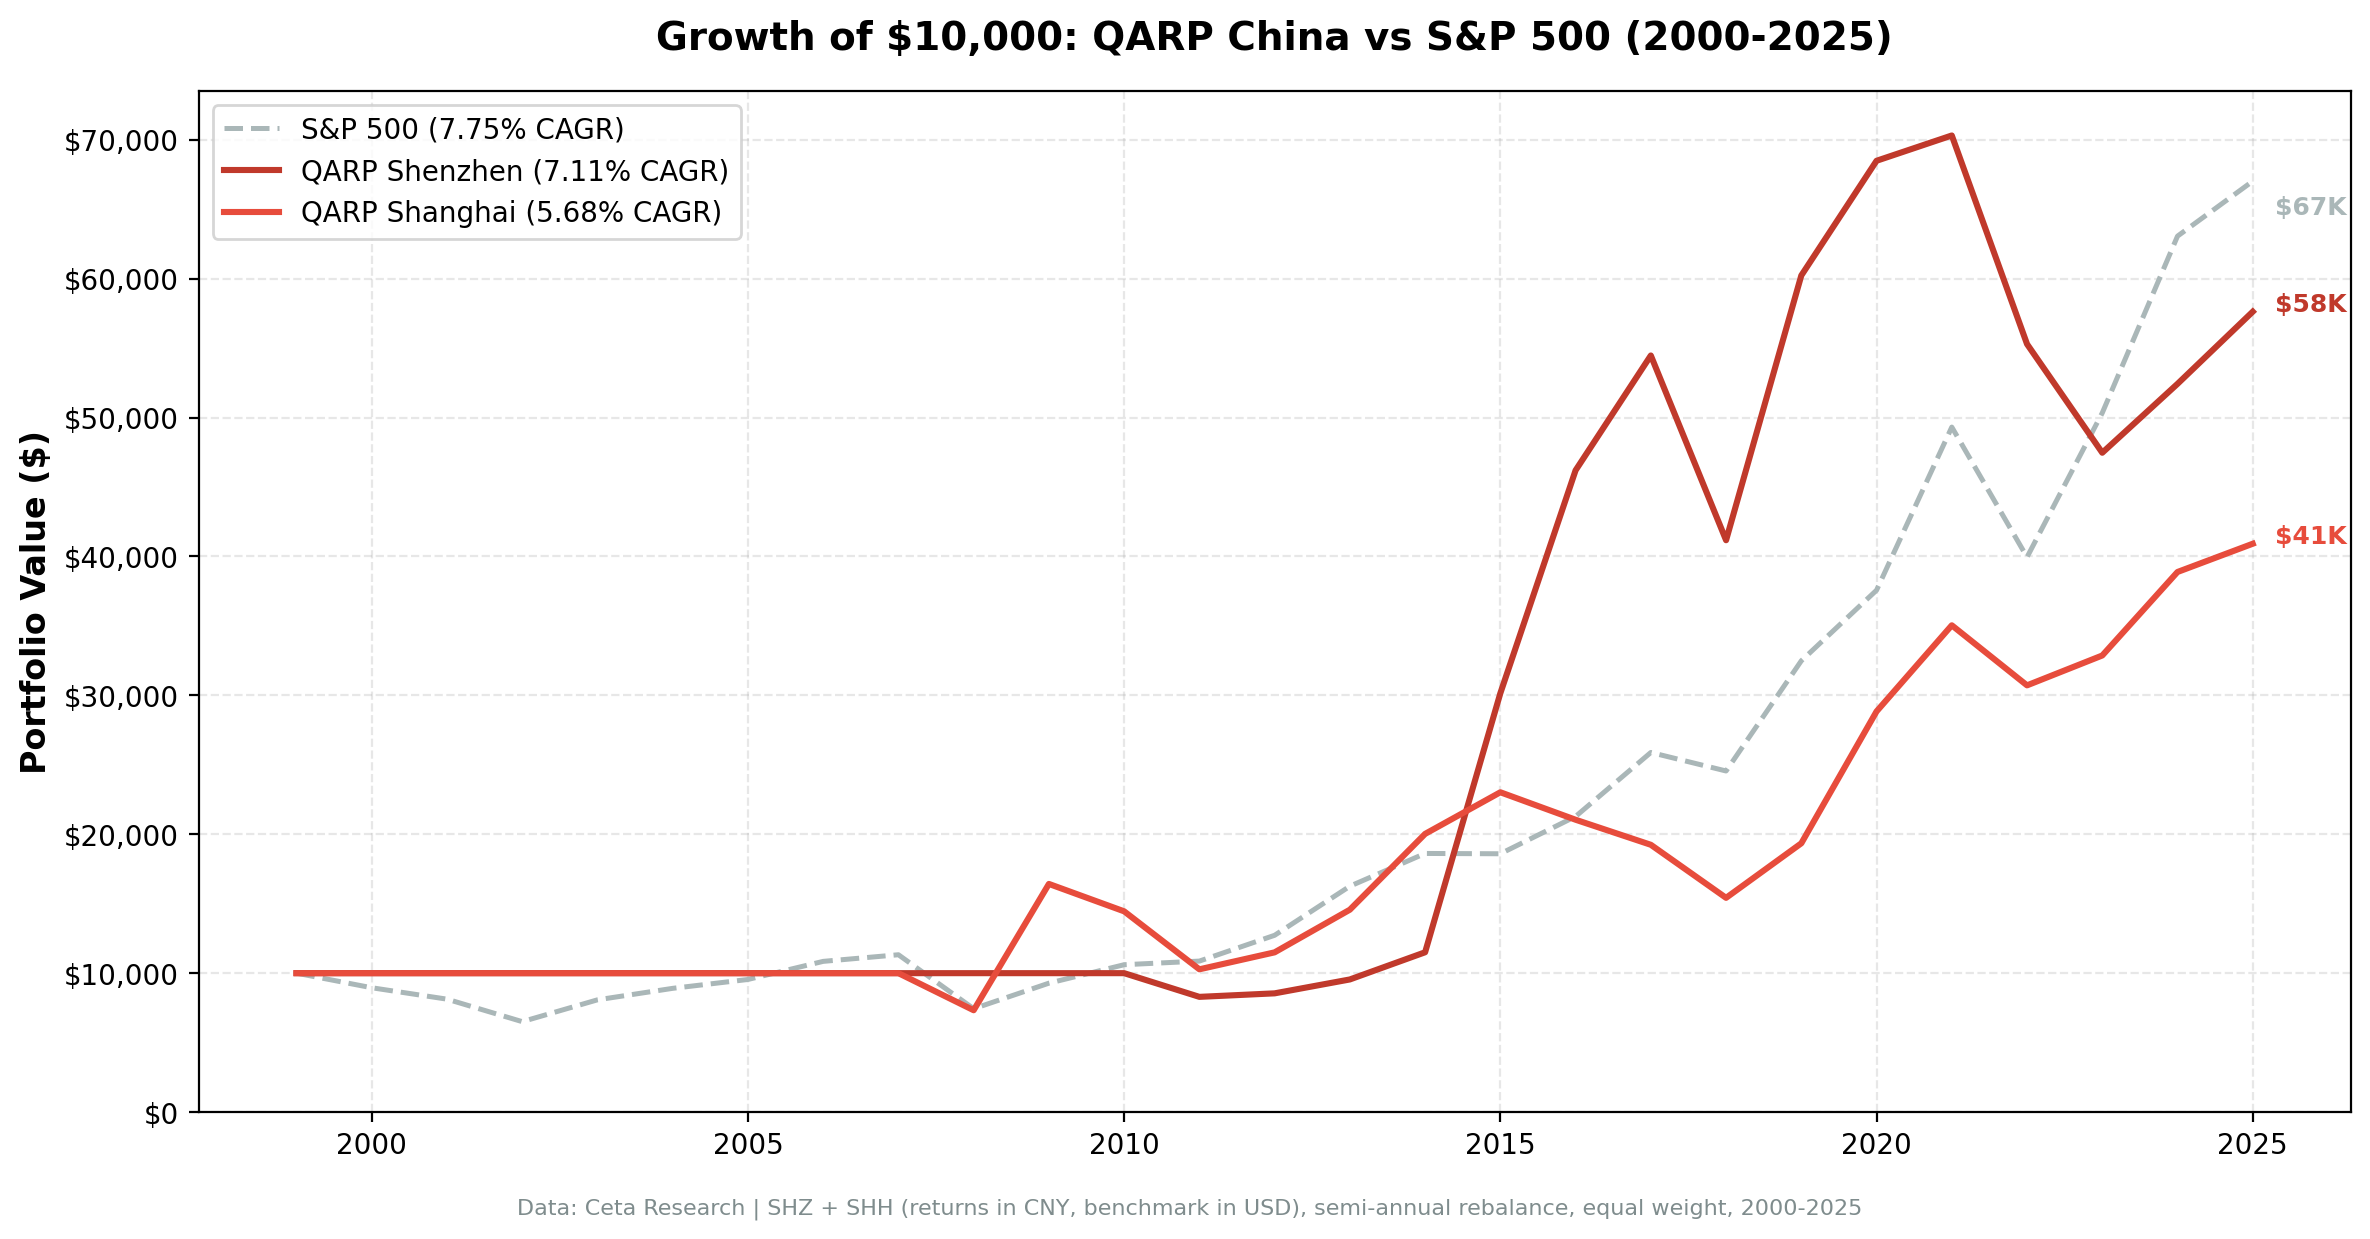
Shanghai QARP returned 6.09% annually, beating the SSE Composite by +2.38%. Shenzhen returned ~4.86% but lacks a local benchmark comparison. Volatile, streaky, and structurally different from Western markets.

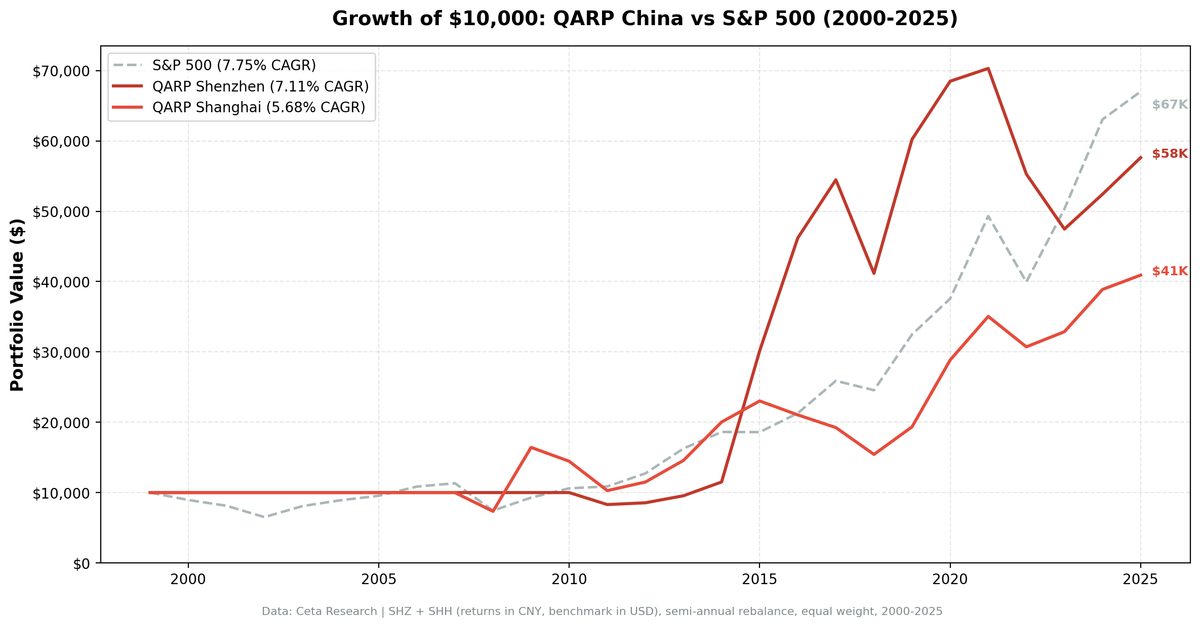
Shanghai QARP returned 6.09% annually, beating the SSE Composite's 3.70% by 2.38%. Shenzhen returned roughly 4.86%, though we can't compare it to a local benchmark (SZSE Component data isn't available in FMP). The raw numbers hide a wilder story. Shanghai's 2009 return of +118.4% was one of the best calendar years across any exchange we've tested. Shenzhen posted +162% in 2015 during the mainland bubble. These aren't boring underperformers. They're volatile, streaky, and structurally different from anything in the US or Europe.
Contents
- Method
- The Screen (SQL)
- Results: Shanghai vs SSE Composite (and Shenzhen)
- Year-by-Year Returns: Shanghai vs SSE Composite
- Key Observations
- Shanghai: +2.38% Alpha Over the SSE Composite
- The 2008 Crisis: Where Quality Mattered Most
- The 2015 Shenzhen Bubble
- Shanghai's 2009 Recovery
- Cash Drag Is a Serious Problem
- 2018: The Shared Low Point
- Currency Considerations
- Why Shenzhen and Shanghai Differ
- Limitations
- Takeaway
- Part of a Series
- Run This Screen Yourself
We ran the same seven-factor QARP screen on both exchanges from 2000 to 2025. The results reveal as much about Chinese markets as they do about the strategy.
Data: FMP financial data warehouse, 2000–2025. Updated March 2026.
Method
Data source: Ceta Research (FMP financial data warehouse) Universe: Shenzhen (SHZ) and Shanghai (SHH), market cap > ¥2B (~$276M USD) Period: 2000-2025 (25 years, 50 semi-annual periods) Rebalancing: Semi-annual (January, July), equal weight all qualifying Benchmark: SSE Composite (for SHH); SZSE Component data unavailable for SHZ Cash rule: Hold cash if fewer than 10 stocks qualify Currency: All returns in CNY
Signal: Piotroski >= 7, ROE > 15%, D/E < 0.5, CR > 1.5, Income Quality (OCF/NI) > 1.0, P/E between 5 and 25, Market Cap > ¥2B (~$276M USD).
The Screen (SQL)
SELECT
    k.symbol,
    p.companyName,
    k.returnOnEquityTTM * 100 as roe_pct,
    f.debtToEquityRatioTTM as debt_to_equity,
    k.currentRatioTTM,
    k.incomeQualityTTM,
    s.piotroskiScore,
    f.priceToEarningsRatioTTM as pe_ratio,
    k.marketCap / 1e9 as market_cap_billions
FROM key_metrics_ttm k
JOIN financial_ratios_ttm f ON k.symbol = f.symbol
JOIN scores s ON k.symbol = s.symbol
JOIN profile p ON k.symbol = p.symbol
WHERE
    p.exchange IN ('SHZ', 'SHH')             -- China: Shenzhen + Shanghai
    AND k.returnOnEquityTTM > 0.15           -- ROE > 15%
    AND f.debtToEquityRatioTTM >= 0
    AND f.debtToEquityRatioTTM < 0.5         -- D/E < 0.5
    AND k.currentRatioTTM > 1.5              -- Current Ratio > 1.5
    AND k.incomeQualityTTM > 1               -- Income Quality > 1
    AND s.piotroskiScore >= 7                -- Piotroski >= 7
    AND f.priceToEarningsRatioTTM > 5        -- P/E 5-25
    AND f.priceToEarningsRatioTTM < 25
    AND k.marketCap > 2000000000             -- Market cap > ¥2B (~$276M USD)
ORDER BY s.piotroskiScore DESC, k.returnOnEquityTTM DESC
Run this query on Ceta Research
Results: Shanghai vs SSE Composite (and Shenzhen)
| Metric | SHH (Shanghai) | SSE Composite | SHZ (Shenzhen) |
|---|---|---|---|
| CAGR | 6.09% | 3.70% | ~4.86% |
| Excess CAGR | +2.38% vs SSE | - | N/A (no benchmark) |
| Volatility | 24.7% | - | 24.9% |
| Max Drawdown | -38.97% | -64.33% | ~-36.6% |
| Sharpe Ratio | 0.147 | - | - |
| Win Rate | 35% | - | 45% |
| Avg Stocks per Period | 12.1 | - | 16.8 |
| Cash Periods | 17/51 | - | 25/51 |
Shanghai QARP beat the SSE Composite by 2.38% annually. The max drawdown of -38.97% compares favorably to the SSE Composite's brutal -64.33%. The quality filters kept you out of the worst carnage.
Shenzhen's CAGR of roughly 4.86% is lower than Shanghai's, but we can't make a direct local benchmark comparison because SZSE Component index data isn't available in FMP.
Year-by-Year Returns: Shanghai vs SSE Composite
| Year | SHH (Shanghai) | SSE Composite | Notes |
|---|---|---|---|
| 2000-07 | Mostly cash | - | Few stocks pass filters |
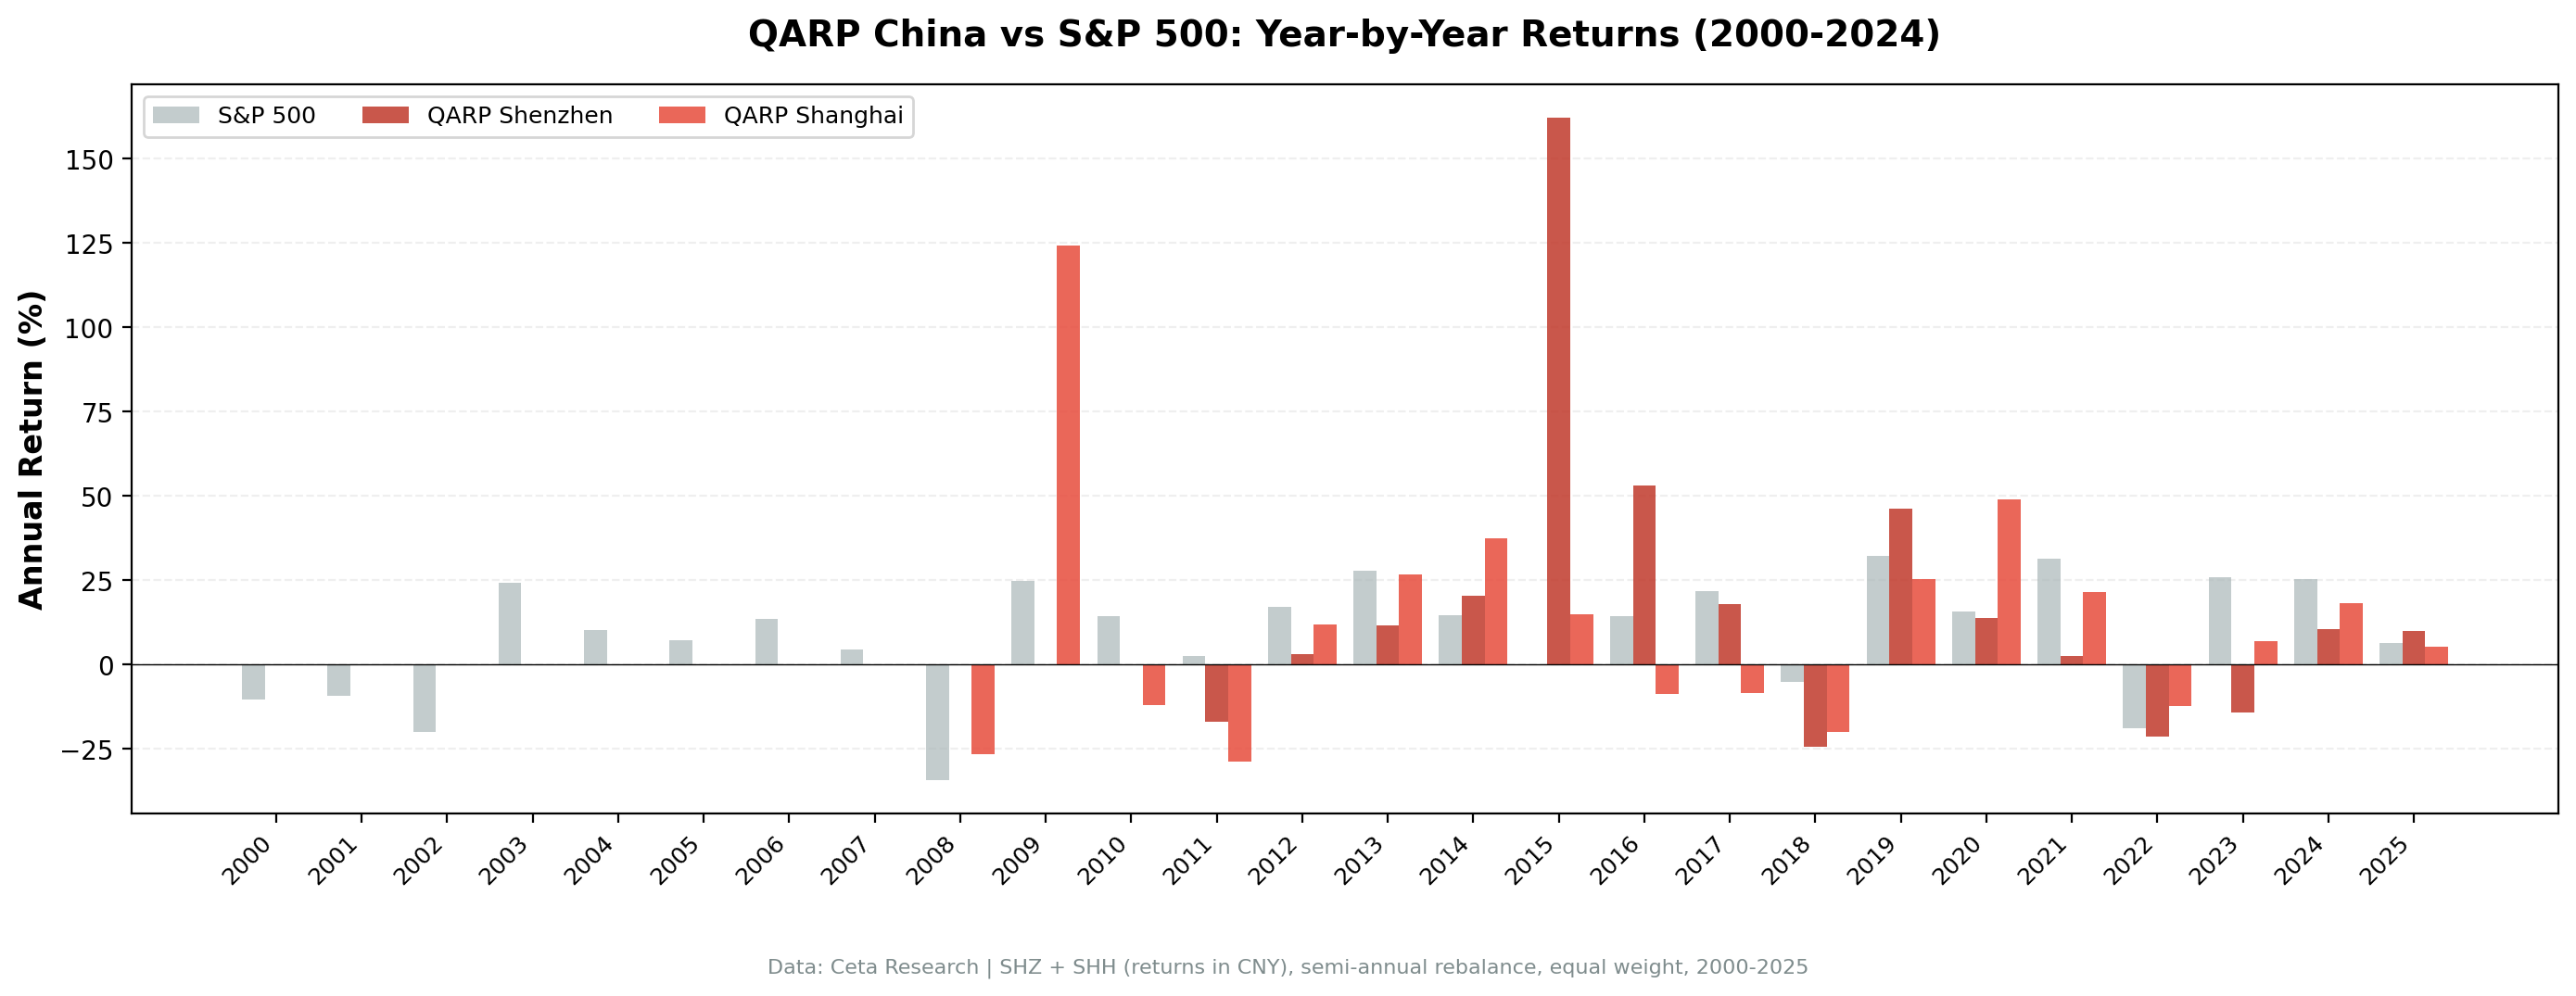
| 2008 | -25.9% | -64.3% | QARP lost far less than the index |
| 2009 | +118.4% | +72.5% | Best single year, massive alpha |
| 2010 | -12.4% | -12.1% | Both down, roughly equal |
| 2011 | -30.4% | -23.9% | Both down |
| 2012 | +11.9% | +5.0% | |
| 2013 | +25.3% | -7.4% | QARP crushed the index |
| 2014 | +37.0% | +58.8% | Pre-bubble run, index led |
| 2015 | +15.6% | -1.6% | QARP positive while index fell |
| 2016 | -0.3% | -4.9% | Both roughly flat |
| 2017 | -4.2% | +6.8% | |
| 2018 | -15.1% | -26.4% | Trade war, QARP lost less |
| 2019 | +24.9% | +25.1% | Roughly matched |
| 2020 | +44.1% | +13.5% | Shanghai QARP tripled the index |
| 2021 | +28.4% | +3.7% | Major alpha |
| 2022 | -13.6% | -14.2% | Both down, roughly equal |
| 2023 | +1.7% | -5.0% | QARP positive, index negative |
| 2024 | +20.2% | +10.1% | Double the index |
| 2025 | +4.2% | +5.9% | Roughly matched |
The two patterns jump out. First, QARP provided downside protection in crises: -25.9% vs -64.3% in 2008, -15.1% vs -26.4% in 2018. Second, QARP captured disproportionate upside in recoveries: +118.4% vs +72.5% in 2009, +44.1% vs +13.5% in 2020.
Key Observations
Shanghai: +2.38% Alpha Over the SSE Composite
This is the headline result. Shanghai QARP beat its local benchmark by 2.38% annually over 25 years. The quality screen adds real value in China's largest exchange. The Sharpe ratio of 0.147 isn't high in absolute terms, but relative to the SSE Composite (which delivered 3.70% CAGR with -64.33% max drawdown), QARP's risk-adjusted return is meaningfully better.
The 2008 Crisis: Where Quality Mattered Most
Shanghai QARP lost 25.9% in 2008. The SSE Composite lost 64.3%. That's a 38-percentage-point gap in a single year. The quality filters, low leverage, strong cash flow, high Piotroski scores, kept QARP out of the most leveraged and vulnerable companies that collapsed during the global crisis. This is QARP doing exactly what it's designed to do.
The 2015 Shenzhen Bubble
Shenzhen's +162% in 2015 remains one of the most extreme single-year returns in any QARP backtest. Margin lending flooded mainland exchanges, and retail investors drove Shenzhen small and mid-caps to absurd levels. Even stocks passing strict quality filters got swept up. The follow-through in 2016 suggests QARP held winners from the run rather than buying at the top.
Shanghai's 2009 Recovery
+118.4% in a single year, far exceeding the SSE Composite's +72.5%. The 2008 crash hit Shanghai hard, and the Chinese government's 4-trillion-yuan stimulus package fueled a rapid recovery. Quality stocks with strong balance sheets attracted capital first.
Cash Drag Is a Serious Problem
Shenzhen sat in cash for 25 of 51 periods (49% of the time). Shanghai was in cash for 17 of 51 (33%). Most of these cash periods cluster in the early years (2000-2010), when fewer Chinese companies met the ¥2B market cap threshold and financial reporting was less standardized. The strategy simply couldn't find 10 qualifying stocks.
This is partly a data coverage issue. Chinese corporate disclosure improved after the CSRC reforms in the mid-2000s. It's also a real signal: fewer Chinese companies passed seven simultaneous quality filters, especially before the market matured.
2018: The Shared Low Point
Both exchanges got hit hard in 2018. Shenzhen lost 24.42%, Shanghai lost 15.1% (vs SSE Composite's -26.4%). US-China trade tensions, deleveraging campaigns, and a slowing domestic economy combined to punish Chinese equities across the board. QARP's quality filters helped limit the damage, at least on Shanghai.
Currency Considerations
All returns are in CNY. This matters, but less than you might think.
The yuan was pegged to the US dollar until July 2005, so early returns have no currency distortion at all. After the peg broke, the CNY appreciated roughly 30% against the USD through 2013, then gradually depreciated. The net effect over 25 years is modest compared to, say, the Indian rupee (which lost about 60% against the dollar over the same period).
For a US-based investor, the USD-adjusted returns would be somewhat lower than reported here during the appreciation period (2005-2013) and somewhat higher during depreciation (2014-present). The gap isn't dramatic enough to change the overall conclusion.
Why Shenzhen and Shanghai Differ
Shenzhen's ~4.86% CAGR trails Shanghai's 6.09%. The reason maps to the composition of each exchange and their cash period frequency.
Shanghai lists many state-owned enterprises (SOEs), but the ones that pass QARP's filters tend to be the quality exceptions. When QARP is invested in Shanghai, it picks the best of a tough universe, and those picks outperform the SSE Composite by a wide margin.
Shenzhen lists more technology, consumer, and growth-oriented companies. Many started as small-caps and grew into the ¥2B+ universe over time. But Shenzhen sat in cash for 25 of 51 periods, nearly half the time. This massive cash drag pulled down the CAGR.
Shanghai had a lower win rate (35% vs 45%) and deeper max drawdown (-38.97% vs ~-36.6%). But its higher CAGR reflects bigger wins when invested, including the +118.4% year in 2009 and +44.1% in 2020.
Limitations
CNY returns, not USD. These numbers don't account for currency conversion costs or hedging. A foreign investor's realized returns will differ.
Data coverage gaps. The early 2000s have sparse financial data for Chinese companies. Many cash periods reflect data unavailability, not necessarily the absence of quality stocks.
Shenzhen benchmark unavailable. SZSE Component index data isn't in FMP, so we can't make a direct local benchmark comparison for Shenzhen. The ~4.86% CAGR stands alone without a benchmark context.
Accounting standards. Chinese GAAP differs from IFRS and US GAAP. Metrics like income quality (OCF/NI) may behave differently when applied to Chinese financial statements. Related-party transactions and off-balance-sheet items are harder to screen for.
Government intervention. Circuit breakers, trading halts, short-selling bans, IPO freezes. Chinese regulators intervene in ways that don't show up in financial statements. No quantitative screen can model policy risk.
Capital controls. Foreign investors access mainland stocks through Stock Connect, QFII, or RQFII, each with quotas and restrictions. The backtest assumes frictionless trading.
Survivorship bias. Uses current exchange membership, not historical. Delisted companies aren't tracked.
Takeaway
Shanghai QARP beats the SSE Composite by 2.38% annually. That's real alpha. The -38.97% max drawdown is harsh, but the SSE Composite's -64.33% puts it in perspective. The quality filters kept you from the worst damage in 2008 and added outsized gains in recoveries (2009, 2020, 2021).
Shenzhen's results are harder to evaluate without a local benchmark. The ~4.86% CAGR is held back by extreme cash drag (25 of 51 periods). When invested, the returns include the remarkable +162% in 2015.
The extreme years are real. Shanghai's +118.4% in 2009 and Shenzhen's +162% in 2015 show that when Chinese quality stocks catch a bid, the upside is enormous. The problem is sitting through cash periods and drawdowns to capture those spikes.
If you're already investing in Chinese equities, QARP adds a genuine quality overlay. The filters keep you out of overleveraged SOEs and earnings-manipulators, which is worth something in a market where accounting fraud makes headlines regularly. Shanghai's +2.38% alpha over the SSE Composite confirms the screen has value. It's a better way to pick Chinese stocks.
Part of a Series
This analysis is part of our QARP global exchange comparison. We tested the same seven-factor screen on 12 exchanges worldwide: - QARP on US Stocks (NYSE + NASDAQ + AMEX) - 10.4% CAGR, the baseline - QARP on Indian Stocks (BSE + NSE) - 9.2% CAGR, lower risk than Sensex - QARP on German Stocks (XETRA) - 8.75% CAGR, +3.7% alpha vs DAX - QARP on Hong Kong Stocks (HKSE) - +2.7% alpha vs Hang Seng - QARP: 12-Exchange Global Comparison - Full comparison table
Run This Screen Yourself
All metrics used in this analysis (Piotroski scores, ROE, P/E, income quality, debt ratios) are queryable via SQL on Ceta Research. Filter by exchange to isolate SHZ or SHH stocks.
The full backtest code (Python + DuckDB) is available in our GitHub repository.
Data: Ceta Research, FMP financial data warehouse. Universe: SHZ (Shenzhen) + SHH (Shanghai). Semi-annual rebalance, equal weight, 2000-2025. Returns in CNY.
Past performance does not guarantee future results. This is educational content, not investment advice.


