
One Stock Screen, 12 Exchanges: Where QARP Adds Alpha vs Local Benchmarks
We ran one quality-value screen across 12 exchanges and compared each to its local benchmark. Germany had the highest alpha (+3.69% vs DAX), the UK came second (+3.06% vs FTSE). India trailed the Sensex.

We took one quality-value screen and ran it across 12 exchanges globally, then compared each to its local benchmark index. Germany produced the most alpha (+3.69% vs DAX). Hong Kong and China, despite weak absolute returns, beat their local indices. India delivered strong absolute returns but trailed the Sensex. The US stayed consistent. Here's everything we found.
Contents
- Method
- The Screen (SQL)
- Full Results
- Where QARP Adds Alpha
- By excess return vs local benchmark:
- By absolute CAGR:
- The Alpha Generators
- XETRA (8.75% CAGR, +3.69% vs DAX)
- LSE (4.14% CAGR, +3.06% vs FTSE 100)
- HKSE (4.02% CAGR, +2.71% vs Hang Seng)
- US_MAJOR (10.42% CAGR, +2.65% vs S&P 500)
- SHH (6.09% CAGR, +2.38% vs SSE Composite)
- Where QARP Trails
- BSE (9.21% CAGR, -2.14% vs Sensex)
- NSE (8.59% CAGR, -2.76% vs Sensex)
- SHZ (4.87% CAGR, no benchmark comparison)
- JPX (1.23% CAGR, -1.71% vs Nikkei)
- TSX (-2.88% CAGR, -7.54% vs S&P/TSX)
- KSC (0.00% CAGR, all cash)
- Key Insights
- QARP adds most value where markets are weak
- Cash drag is the biggest risk factor
- Drawdown varies wildly across markets
- Absolute returns and alpha are different things
- What This Means for Investors
- Part of a Series
- Run This Screen Yourself
Data: FMP financial data warehouse, 2000–2025. Updated March 2026.
Method
Signal: Piotroski >= 7, ROE > 15%, D/E < 0.5, CR > 1.5, Income Quality (OCF/NI) > 1.0, P/E 5-25, Market Cap > 1B local currency (exchange-specific thresholds) Portfolio: Equal weight all qualifying stocks. Semi-annual rebalance (January, July). Cash rule: Hold cash if fewer than 10 stocks qualify. Period: 2000-2025 (51 semi-annual periods) Benchmarks: Each exchange benchmarked against its local index. S&P 500 for US, Sensex for India (BSE and NSE), DAX for Germany, Hang Seng for Hong Kong, SSE Composite for Shanghai. SHZ has no reliable benchmark data for this period. Exchanges tested: 12 exchanges with data (US_MAJOR, BSE, NSE, XETRA, SHH, SHZ, HKSE, LSE, JPX, TAI, KSC, TSX). SET, SAU, JNB also tested but had insufficient qualifying stocks.
Same screen, same parameters, same rebalance dates. The only variable is the stock universe. Market cap thresholds are exchange-specific: $1B USD for US exchanges, ₹20B for India, €500M for Germany, ¥2B for China, HK$2B for Hong Kong, matching local currency conventions and market structures.
For full methodology, Piotroski computation details, and SQL, see the main US QARP post.
The Screen (SQL)
SELECT
    k.symbol,
    p.companyName,
    p.exchange,
    k.returnOnEquityTTM * 100 as roe_pct,
    f.debtToEquityRatioTTM as debt_to_equity,
    k.currentRatioTTM,
    k.incomeQualityTTM,
    s.piotroskiScore,
    f.priceToEarningsRatioTTM as pe_ratio,
    k.marketCap / 1e9 as market_cap_billions
FROM key_metrics_ttm k
JOIN financial_ratios_ttm f ON k.symbol = f.symbol
JOIN scores s ON k.symbol = s.symbol
JOIN profile p ON k.symbol = p.symbol
WHERE
    k.returnOnEquityTTM > 0.15               -- ROE > 15%
    AND f.debtToEquityRatioTTM >= 0
    AND f.debtToEquityRatioTTM < 0.5         -- D/E < 0.5
    AND k.currentRatioTTM > 1.5              -- Current Ratio > 1.5
    AND k.incomeQualityTTM > 1               -- Income Quality > 1
    AND s.piotroskiScore >= 7                -- Piotroski >= 7
    AND f.priceToEarningsRatioTTM > 5        -- P/E 5-25
    AND f.priceToEarningsRatioTTM < 25
    AND k.marketCap > 1e9                    -- Market cap threshold (exchange-specific)
ORDER BY s.piotroskiScore DESC, k.returnOnEquityTTM DESC
LIMIT 100
Run this query on Ceta Research
Full Results
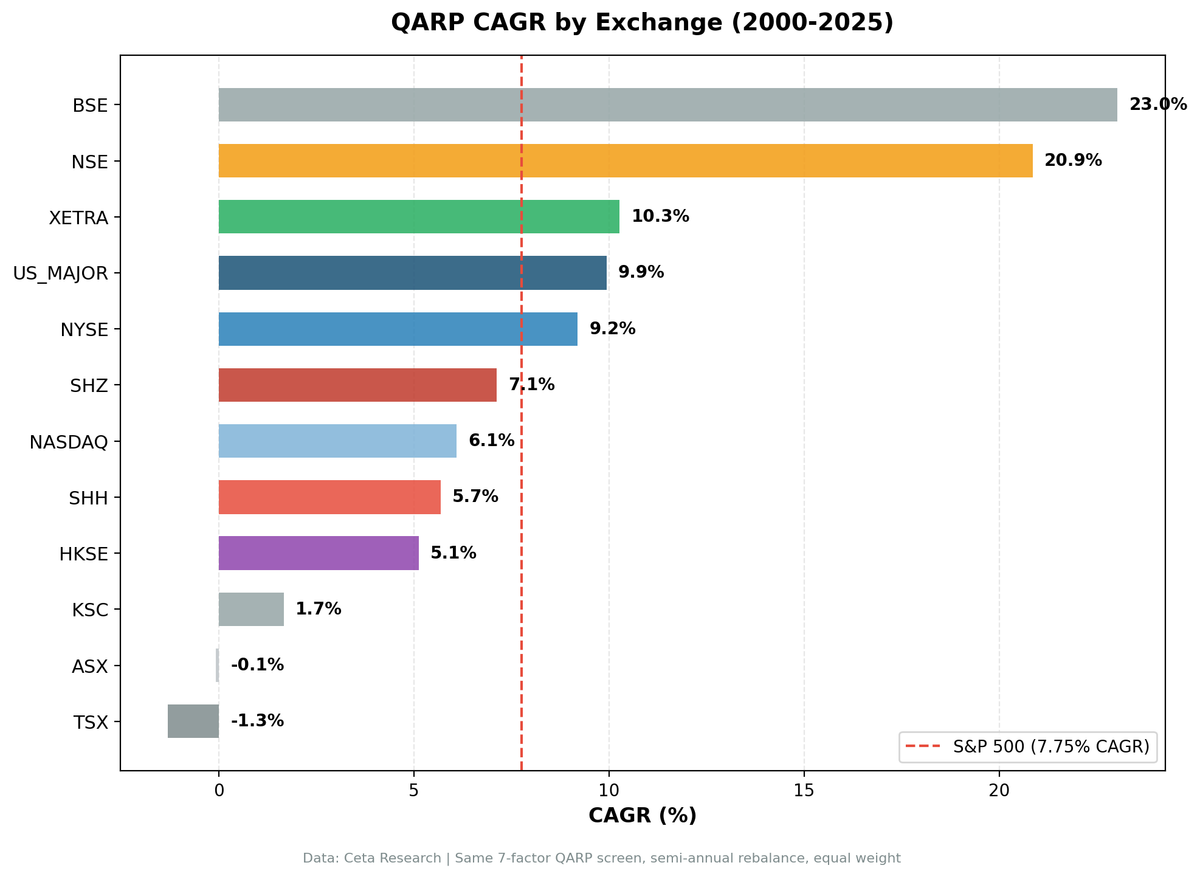
Sorted by CAGR descending. Each exchange compared to its local benchmark index, not a single global benchmark.
| Exchange | CAGR | Benchmark | Bench CAGR | Excess | MaxDD | Sharpe | Cash Periods | Avg Stocks |
|---|---|---|---|---|---|---|---|---|
| US_MAJOR | 10.42% | S&P 500 | 7.77% | +2.65% | -27.1% | 0.502 | 0/51 | 44.3 |
| BSE | 9.21% | Sensex | 11.35% | -2.14% | -17.1% | 0.173 | 29/51 | 15.8 |
| XETRA | 8.75% | DAX | 5.06% | +3.69% | -32.7% | 0.360 | 13/51 | 15.0 |
| NSE | 8.59% | Sensex | 11.35% | -2.76% | -19.4% | 0.137 | 26/51 | 16.1 |
| SHH | 6.09% | SSE Comp. | 3.70% | +2.38% | -39.0% | 0.147 | 17/51 | 12.1 |
| SHZ | 4.87% | (no data) | N/A | N/A | -36.5% | 0.119 | 25/51 | 16.8 |
| LSE | 4.14% | FTSE 100 | 1.08% | +3.06% | -31.4% | 0.049 | 21/51 | 15.8 |
| HKSE | 4.02% | Hang Seng | 1.31% | +2.71% | -52.7% | 0.047 | 16/51 | 13.1 |
| TAI | 1.57% | TAIEX | 3.78% | -2.21% | -36.8% | 0.034 | 23/51 | 18.3 |
| JPX | 1.23% | Nikkei | 2.94% | -1.71% | -48.4% | 0.073 | 35/51 | 13.9 |
| KSC | 0.00% | KOSPI | 4.27% | -4.27% | 0.0% | N/A | 51/51 | 0.0 |
| TSX | -2.88% | S&P/TSX | 4.66% | -7.54% | -67.2% | -0.501 | 38/51 | 12.1 |
KSC had no qualifying stocks across all 51 periods. SET, SAU, and JNB were also tested but produced near-zero or negative returns with extreme cash drag (43-51 cash periods).
Where QARP Adds Alpha
The right question isn't "which exchange had the highest CAGR?" It's "where did QARP beat what you'd have earned holding the local index?" Those are different questions with different answers.
By excess return vs local benchmark:
- XETRA: +3.69% vs DAX
- LSE: +3.06% vs FTSE 100
- HKSE: +2.71% vs Hang Seng
- US_MAJOR: +2.65% vs S&P 500
- SHH: +2.38% vs SSE Composite
By absolute CAGR:
- US_MAJOR: 10.42%
- BSE: 9.21%
- XETRA: 8.75%
These rankings tell different stories. BSE ranks #2 by absolute returns but produced negative alpha vs the Sensex. LSE ranks near the bottom by absolute returns but delivered the second-highest alpha of any exchange.
The Alpha Generators
Five exchanges beat their local benchmarks.
XETRA (8.75% CAGR, +3.69% vs DAX)
The alpha leader. Germany's DAX returned 5.06% annualized over this period, and QARP added 3.69% on top. 13 cash periods out of 51 means the strategy was invested most of the time. Max drawdown of -32.7% is steep but still within normal bounds for a 25-year equity strategy. German industrials (Mittelstand companies) fit the QARP profile well: high ROE, low leverage, real cash flows. Germany post.
LSE (4.14% CAGR, +3.06% vs FTSE 100)
The UK joins Germany as an alpha generator. The FTSE 100 returned just 1.08% annualized over 25 years, one of the weakest major benchmarks globally. QARP added 3.06% on top. The strategy was in cash for 21 of 51 periods and averaged 15.8 stocks when invested. UK-listed quality industrials and consumer companies fit the QARP profile well, similar to Germany's Mittelstand effect. The Sharpe of 0.049 is low in absolute terms, but the FTSE's Sharpe was worse.
HKSE (4.02% CAGR, +2.71% vs Hang Seng)
Hong Kong's absolute return of 4.02% looks poor. But the Hang Seng returned just 1.31% over this period. QARP added 2.71% of alpha in one of the world's worst-performing major markets. The -52.7% max drawdown is brutal, and the Sharpe of 0.047 barely clears zero. But the screen did what it's supposed to do: picked better stocks than the index in a tough environment. Hong Kong post.
US_MAJOR (10.42% CAGR, +2.65% vs S&P 500)
The most consistent result. Zero cash periods across 25 years, 44.3 qualifying stocks per period. The Sharpe of 0.502 was the highest of any exchange. The US market's breadth means the screen always finds enough qualifying names. No gaps, no dry spells. US post.
SHH (6.09% CAGR, +2.38% vs SSE Composite)
Shanghai's SSE Composite returned 3.70% over 25 years. QARP added 2.38%. Cash drag was moderate (17/51 periods). The 12.1 average stocks per period is thin, so the alpha comes from a concentrated book. The -39.0% drawdown is in line with Chinese equity volatility. China post.
Where QARP Trails
BSE (9.21% CAGR, -2.14% vs Sensex)
India's Bombay Stock Exchange delivered 9.21% annualized. Strong in absolute terms. But the Sensex returned 11.35% over the same period. QARP underperformed by 2.14% per year. The culprit is cash drag: 29 out of 51 periods in cash. The screen's strict filters excluded too many Indian stocks, and when no stocks qualified, the portfolio sat in cash while the Sensex kept climbing. When QARP was invested, the picks were solid. But 57% of the time, the strategy was on the sidelines. Full analysis in the India post.
NSE (8.59% CAGR, -2.76% vs Sensex)
Same story as BSE. The National Stock Exchange produced 8.59% annualized but trailed the Sensex by 2.76%. Cash drag was even worse: 26 out of 51 periods idle, with only 16.1 stocks on average when invested. The strict quality filters that protect you in weak markets become a penalty in a market as strong as India's. India post.
SHZ (4.87% CAGR, no benchmark comparison)
Shenzhen produced positive absolute returns but we don't have reliable benchmark data for a direct comparison. 25/51 cash periods. The 16.8 average stocks per period is reasonable when invested. China post.
JPX (1.23% CAGR, -1.71% vs Nikkei)
Japan produced the lowest positive CAGR of any exchange with data. The Nikkei returned 2.94% over 25 years, and QARP trailed by 1.71%. Cash periods dominated: 35 of 51. Japanese companies often carry higher leverage than QARP's D/E < 0.5 threshold allows, and the P/E filter struggles with Japan's historically depressed valuations (many quality Japanese stocks trade below P/E 5, failing the minimum floor).
TSX (-2.88% CAGR, -7.54% vs S&P/TSX)
Canada was the worst performer. The S&P/TSX returned 4.66% while QARP lost money. 38 cash periods out of 51. Canada's market is dominated by banks and resource companies, both of which fail QARP's leverage and earnings quality filters. When the screen did find qualifying stocks, the concentrated portfolios produced high drawdowns (-67.2%).
KSC (0.00% CAGR, all cash)
Korea had no qualifying stocks across all 51 periods. The QARP filters are too strict for the KSC universe at the $1B market cap threshold. Korean companies that meet the ROE and Piotroski requirements tend to fail the D/E or P/E filters.
Key Insights
QARP adds most value where markets are weak
A clear pattern emerged. The exchanges where QARP generated the most alpha are the ones where the underlying index had the lowest returns. DAX (5.06%), FTSE 100 (1.08%), Hang Seng (1.31%), SSE Composite (3.70%) all had mediocre index performance, and QARP beat all four. India's Sensex (11.35%) was a strong market, and QARP couldn't keep up. When the index itself is compounding at 11%+, a strict quality screen that forces you into cash half the time can't compete.
Cash drag is the biggest risk factor
BSE had 29 of 51 periods in cash. NSE had 26. The US had zero. Cash periods directly correlate with underperformance vs local benchmarks. The strict seven-filter screen works as a stock picker, but it needs a deep enough universe to stay invested. Broader universes reduce this drag.
Drawdown varies wildly across markets
BSE's max drawdown was -17.1%. HKSE's was -52.7%. Same screen, 35 percentage points of difference in worst-case loss. Exchange-specific factors (liquidity, sector composition, macro regime) drive drawdown more than stock selection.
Absolute returns and alpha are different things
The highest absolute CAGR (US at 10.42%) wasn't the highest alpha (+2.65%). The highest alpha (XETRA at +3.69%) wasn't the highest CAGR (8.75%). Investors need to decide what they're optimizing for. If you already have local index exposure, alpha is what matters. If you're choosing where to deploy capital, absolute returns matter more.
What This Means for Investors
QARP adds the most value in markets where the index itself has been weak. If your local market is already compounding at 10%+, a strict quality screen with frequent cash periods will likely trail. If your local market is grinding out 3-5%, QARP can meaningfully improve on that.
For US investors: QARP remains a solid overlay. +2.65% alpha, zero cash periods, 0.502 Sharpe. The most reliable implementation across all exchanges.
For European investors: XETRA and LSE are both standouts. XETRA leads with +3.69% alpha, LSE follows with +3.06%. Both have weak underlying benchmarks (DAX 5.06%, FTSE 1.08%) where quality screening adds the most value. German and British industrials are a natural fit for quality-value screens.
For Asian investors: It depends on the market. Hong Kong and Shanghai delivered alpha despite poor absolute returns. India trailed its benchmark due to cash drag. A less strict filter set (lower Piotroski threshold, wider P/E range) might reduce cash periods in Indian markets.
For everyone: The strict seven-filter screen is a stock picker, not a market timer. It works best when paired with a market that gives it enough qualifying candidates to stay invested. If your market concentrates in sectors that fail the quality filters (mining, banking, state-owned enterprises), QARP will spend too much time in cash.
Part of a Series
This is the global comparison post. Individual exchange analyses with year-by-year breakdowns:
- QARP on US Stocks (NYSE + NASDAQ + AMEX) - 10.42% CAGR, +2.65% vs S&P 500
- QARP on Indian Stocks (BSE + NSE) - 9.21% / 8.59% CAGR, trails Sensex
- QARP on German Stocks (XETRA) - 8.75% CAGR, +3.69% vs DAX (highest alpha)
- QARP on Chinese Stocks (SHZ + SHH) - SHH beats SSE Composite by +2.38%
- QARP on Hong Kong Stocks (HKSE) - 4.02% CAGR, +2.71% vs Hang Seng
Run This Screen Yourself
All metrics used in this analysis (Piotroski scores, ROE, P/E, income quality, debt ratios) are queryable via SQL on Ceta Research. Filter by exchange and see what passes today.
The full backtest code (Python + DuckDB) is available in our GitHub repository.
Data: Ceta Research, FMP financial data warehouse. 12 exchanges tested, semi-annual rebalance, equal weight, 2000-2025. Each exchange compared to its local benchmark index. Returns in local currency.
Past performance does not guarantee future results. This is educational content, not investment advice.


