
QARP on Indian Stocks: Lower Risk, Not Higher Returns
QARP returned 9.2% on BSE and 8.6% on NSE, trailing the Sensex at 11.4%. But max drawdown was a third of the index. In India, QARP is a risk tool, not an alpha generator.


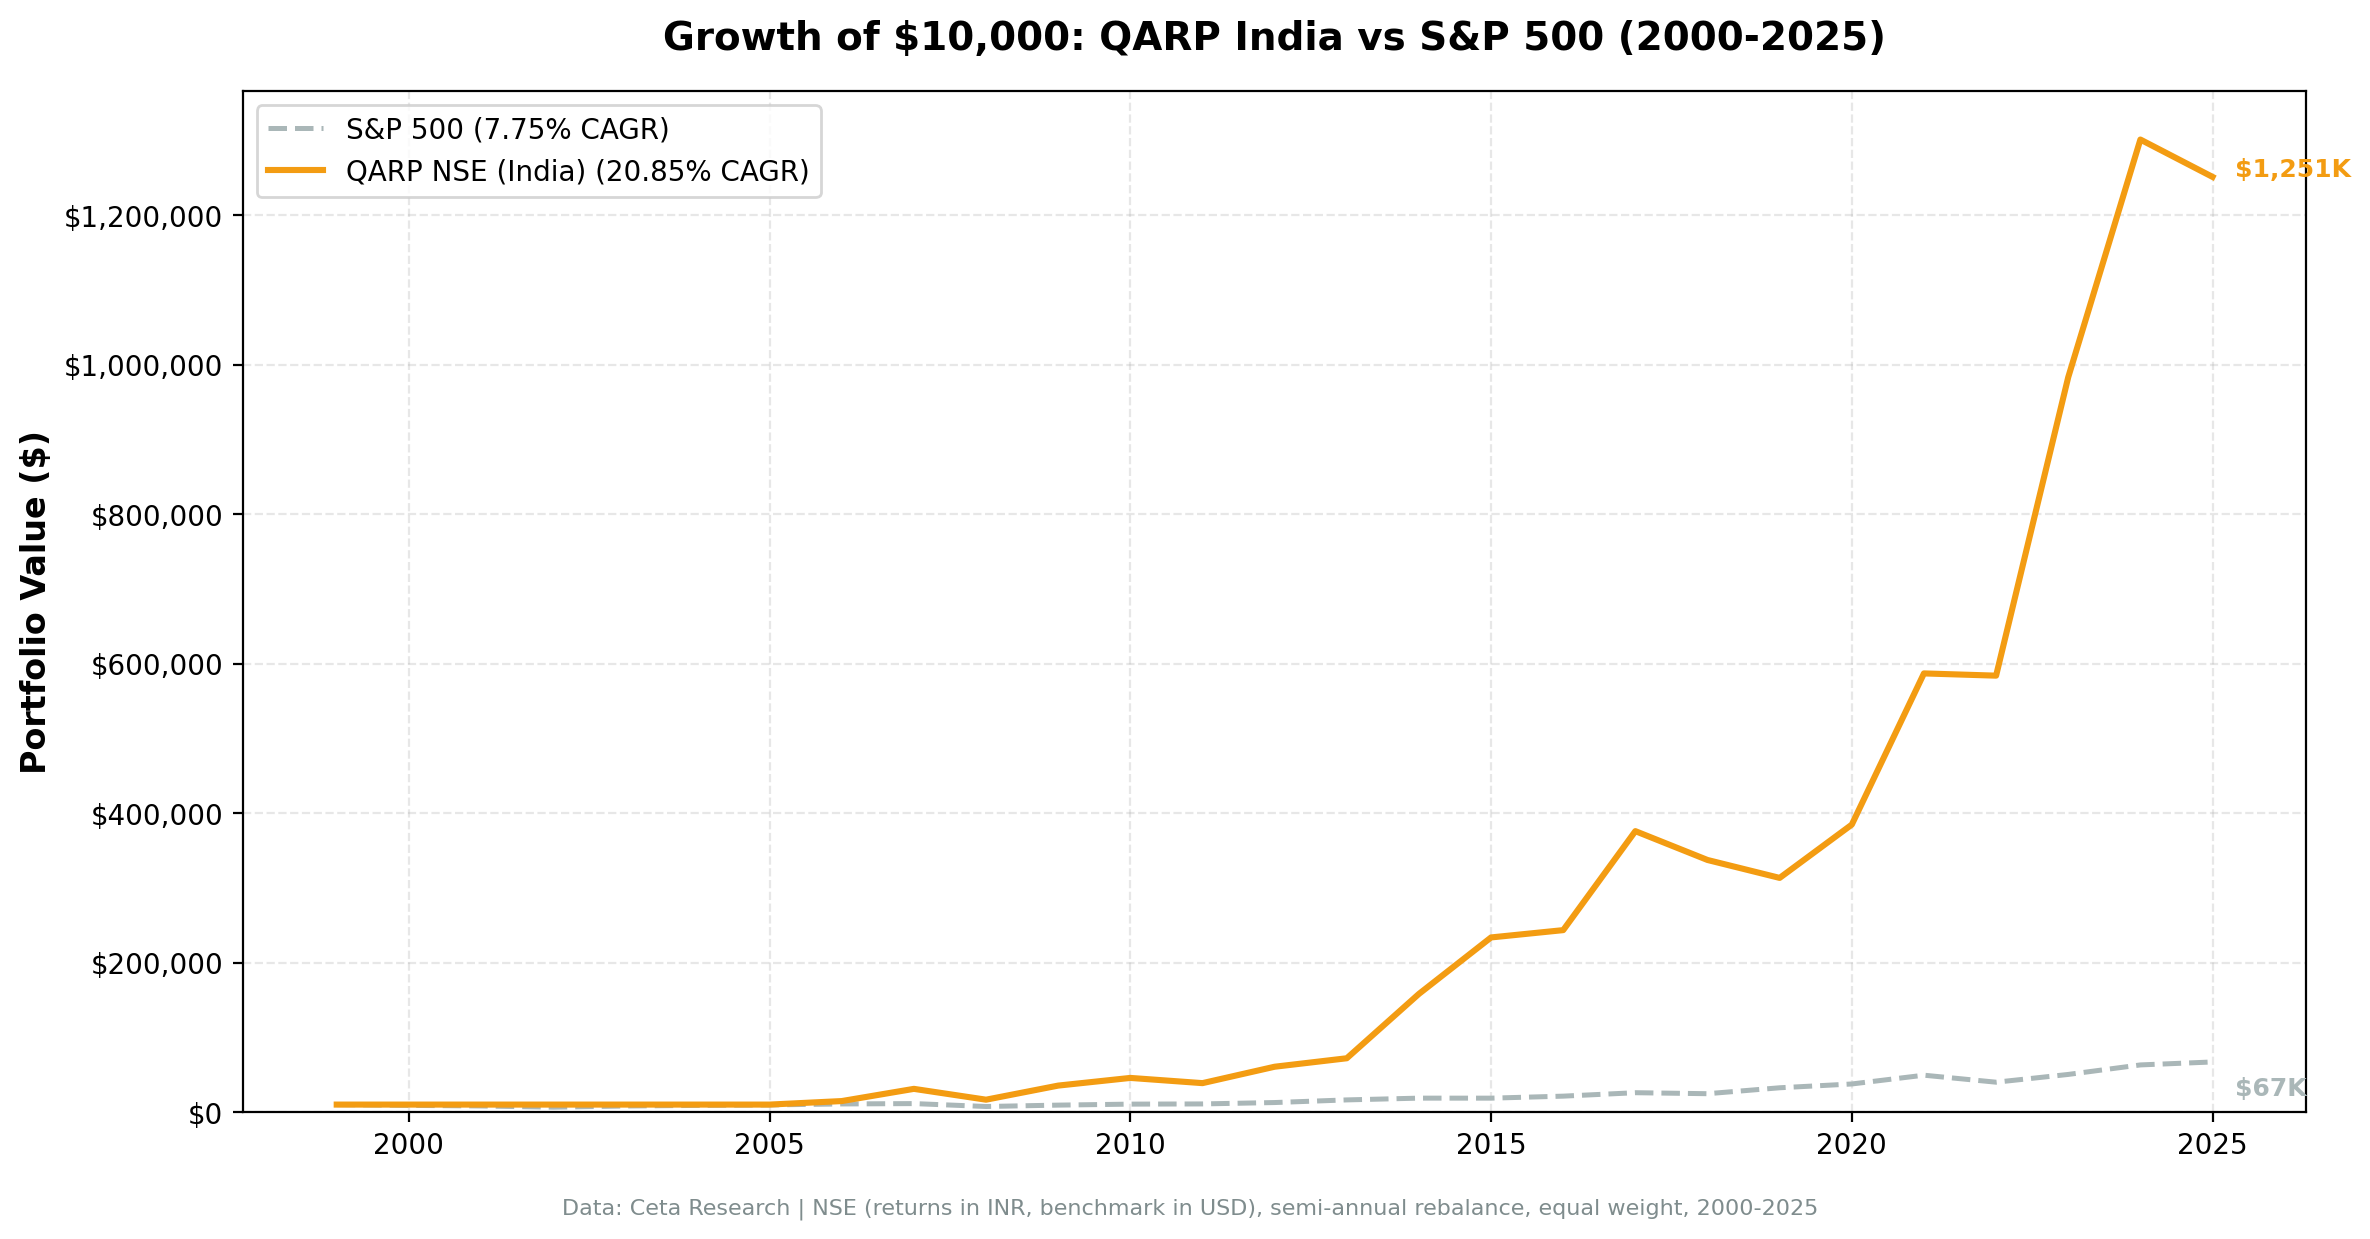
QARP on BSE returned 9.21% CAGR. NSE returned 8.59%. Both trailed the Sensex's 11.35% over the same period. The strategy didn't beat the Indian market. But it offered dramatically lower drawdowns: BSE's worst peak-to-trough was -17.08%, roughly a third of the Sensex's -51.34%. QARP in India is a risk-reduction tool, not an alpha generator. The 846% total return on BSE and 718% on NSE came with far less pain than buying and holding the index.
Contents
- Method
- The Screen (SQL)
- Combined Results
- Year-by-Year Returns
- BSE vs Sensex
- NSE vs Sensex
- Key Observations
- 2000-2009: Ten years of cash
- 2010-2013: Rocky start
- 2014: Modest Modi rally
- 2020-2021: Post-COVID strength
- 2023-2024: The standout period
- Currency Note
- BSE vs NSE Comparison
- Limitations
- Takeaway
- Part of a Series
- Run This Screen Yourself
Data: FMP financial data warehouse, 2000–2025. Updated March 2026.
Method
Signal: Piotroski >= 7, ROE > 15%, D/E < 0.5, CR > 1.5, Income Quality (OCF/NI) > 1.0, P/E 5-25, Market Cap > ₹20B (~$240M USD) Portfolio: Equal weight all qualifying stocks. Semi-annual rebalance (January, July). Cash rule: Hold cash if fewer than 10 stocks qualify. Period: 2000-2025 (51 semi-annual periods) Benchmark: Sensex (^BSESN, INR)
For the full methodology and Piotroski computation details, see the main US QARP post.
The Screen (SQL)
SELECT
    k.symbol,
    p.companyName,
    p.exchange,
    k.returnOnEquityTTM * 100 as roe_pct,
    f.debtToEquityRatioTTM as debt_to_equity,
    k.currentRatioTTM as current_ratio,
    k.incomeQualityTTM as income_quality,
    s.piotroskiScore,
    f.priceToEarningsRatioTTM as pe_ratio,
    k.marketCap / 1e9 as market_cap_billions
FROM key_metrics_ttm k
JOIN financial_ratios_ttm f ON k.symbol = f.symbol
JOIN scores s ON k.symbol = s.symbol
JOIN profile p ON k.symbol = p.symbol
WHERE k.returnOnEquityTTM > 0.15
    AND f.debtToEquityRatioTTM >= 0 AND f.debtToEquityRatioTTM < 0.5
    AND k.currentRatioTTM > 1.5
    AND k.incomeQualityTTM > 1
    AND s.piotroskiScore >= 7
    AND f.priceToEarningsRatioTTM > 5 AND f.priceToEarningsRatioTTM < 25
    AND k.marketCap > 20e9  -- ₹20B (~$240M USD)
    AND p.exchange IN ('BSE', 'NSE')
ORDER BY s.piotroskiScore DESC, k.returnOnEquityTTM DESC
Run this query on Ceta Research
Combined Results
| Metric | BSE (INR) | NSE (INR) | Sensex (INR) |
|---|---|---|---|
| CAGR | 9.21% | 8.59% | 11.35% |
| Total Return | 846% | 718% | 1,035% |
| Max Drawdown | -17.08% | -19.38% | -51.34% |
| Sharpe Ratio | 0.173 | 0.137 | 0.186 |
| Volatility | - | - | 26.15% |
| Excess CAGR vs Sensex | -2.14% | -2.76% | - |
| Win Rate (semi-annual) | - | 43.14% | - |
| Avg Stocks per Period | 15.8 | 16.1 | - |
| Cash Periods | 29 / 51 | 26 / 51 | - |
BSE has the higher CAGR but both trail the Sensex. The drawdown story is the real differentiator: BSE's -17.08% max drawdown is a third of the Sensex's -51.34%. Cash periods are high. BSE was in cash for 29 of 51 periods, NSE for 26. Most of that cash is concentrated in 2000-2009 when too few Indian large-caps passed the screen.
Year-by-Year Returns
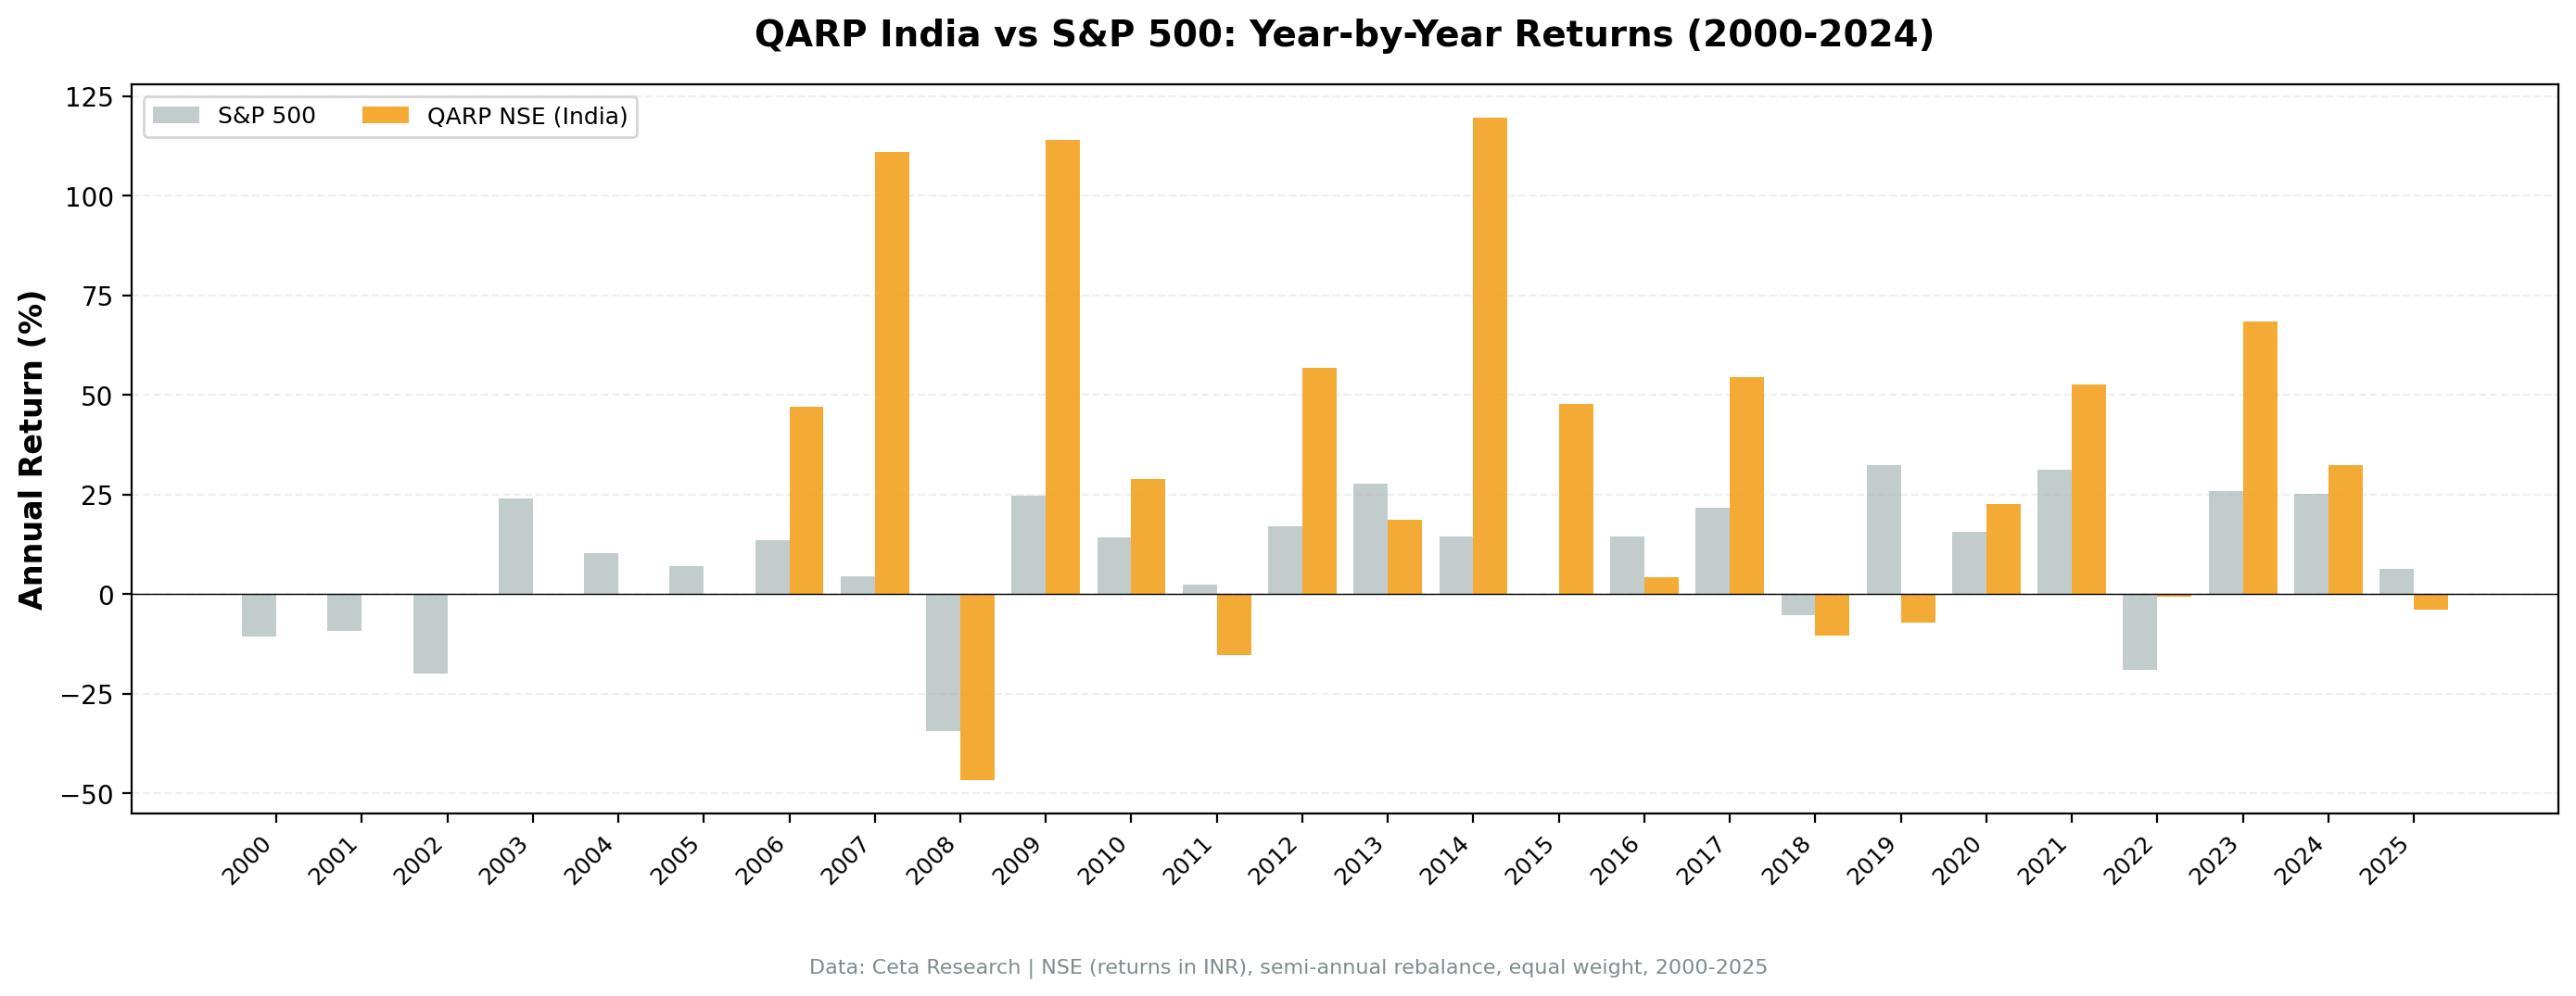
BSE vs Sensex
| Year | BSE (INR) | Sensex (INR) | Excess |
|---|---|---|---|
| 2000 | 0.0% (cash) | -25.2% | +25.2% |
| 2001 | 0.0% (cash) | -18.6% | +18.6% |
| 2002 | 0.0% (cash) | +2.9% | -2.9% |
| 2003 | 0.0% (cash) | +79.1% | -79.1% |
| 2004 | 0.0% (cash) | +10.8% | -10.8% |
| 2005 | 0.0% (cash) | +40.6% | -40.6% |
| 2006 | 0.0% (cash) | +48.5% | -48.5% |
| 2007 | 0.0% (cash) | +46.8% | -46.8% |
| 2008 | 0.0% (cash) | -51.3% | +51.3% |
| 2009 | 0.0% (cash) | +76.3% | -76.3% |
| 2010 | +10.2% | +17.1% | -7.0% |
| 2011 | -17.1% | -24.5% | +7.4% |
| 2012 | +18.7% | +27.0% | -8.3% |
| 2013 | -10.6% | +6.0% | -16.6% |
| 2014 | +36.4% | +33.5% | +2.9% |
| 2015 | 0.0% (cash) | -8.1% | +8.1% |
| 2016 | +9.8% | +3.8% | +6.0% |
| 2017 | +26.0% | +27.1% | -1.1% |
| 2018 | +5.2% | +6.2% | -1.0% |
| 2019 | +11.9% | +16.0% | -4.1% |
| 2020 | +38.0% | +15.7% | +22.3% |
| 2021 | +30.0% | +22.9% | +7.2% |
| 2022 | +1.9% | +3.4% | -1.5% |
| 2023 | +60.9% | +17.5% | +43.4% |
| 2024 | +38.8% | +11.2% | +27.6% |
| 2025 | +7.6% | +4.3% | +3.3% |
NSE vs Sensex
| Year | NSE (INR) | Sensex (INR) | Excess |
|---|---|---|---|
| 2000-2009 | 0.0% (cash) | (same as above) | - |
| 2010 | +12.0% | +17.1% | -5.1% |
| 2011 | -19.4% | -24.5% | +5.1% |
| 2012 | +48.4% | +27.0% | +21.4% |
| 2013 | -11.2% | +6.0% | -17.1% |
| 2014 | +30.0% | +33.5% | -3.5% |
| 2015 | 0.0% (cash) | -8.1% | +8.1% |
| 2016 | +8.9% | +3.8% | +5.1% |
| 2017 | +43.3% | +27.1% | +16.1% |
| 2018 | -3.3% | +6.1% | -9.4% |
| 2019 | +6.0% | +16.0% | -10.0% |
| 2020 | +25.9% | +15.7% | +10.1% |
| 2021 | +20.7% | +22.8% | -2.2% |
| 2022 | -4.6% | +3.4% | -8.0% |
| 2023 | +58.3% | +17.5% | +40.8% |
| 2024 | +34.3% | +11.2% | +23.1% |
| 2025 | +7.1% | +4.3% | +2.7% |
Key Observations
2000-2009: Ten years of cash
The strategy sat in cash for a full decade. India's large-cap universe was small in the early 2000s, and too few companies passed all seven filters at a ₹20B market cap threshold. The Sensex returned +79.1% in 2003 and +48.5% in 2006. QARP missed all of it. The 9.21% CAGR is computed over the full 25 years, including ten years of dead weight. Active returns only started in 2010.
2010-2013: Rocky start
Once the strategy deployed capital, results were mixed. BSE gained 10.2% in 2010 but dropped 17.1% in 2011. Both exchanges trailed the Sensex in most of these years. The qualifying stock universe was still thin.
2014: Modest Modi rally
BSE gained 36.4%, narrowly beating the Sensex's 33.5%. NSE gained 30.0%, trailing the benchmark. The election of a business-friendly government lifted quality stocks, but QARP's concentrated portfolio didn't capture the full re-rating the way the broader index did.
2020-2021: Post-COVID strength
BSE returned +38.0% in 2020 and +30.0% in 2021, beating the Sensex both years. Quality companies with strong balance sheets recovered faster. This was QARP doing what it's designed to do: outperforming when financial discipline matters.
2023-2024: The standout period
BSE returned +60.9% in 2023, +38.8% in 2024. NSE returned +58.3% and +34.3%. Both crushed the Sensex by 25-40 percentage points. Domestic consumption growth, manufacturing policy (PLI schemes), and expanding market depth all contributed. These two years account for most of QARP's total return on Indian exchanges.
Currency Note
All returns in this post are in Indian Rupees. The benchmark (Sensex) is also in INR, so the comparison is apples-to-apples. For US-based investors, note that the INR/USD exchange rate moved from roughly 43 in 2000 to roughly 84 in 2024. That's about a 2.7% annual drag on USD-converted returns. The relative performance vs the Sensex is unaffected by currency.
BSE vs NSE Comparison
| Metric | BSE | NSE |
|---|---|---|
| CAGR | 9.21% | 8.59% |
| Total Return | 846% | 718% |
| Max Drawdown | -17.08% | -19.38% |
| Sharpe Ratio | 0.173 | 0.137 |
| Avg Stocks | 15.8 | 16.1 |
| Cash Periods | 29/51 | 26/51 |
| Win Rate | - | 43.14% |
BSE has the higher CAGR and the smaller drawdown. NSE has slightly more periods with capital deployed (26 cash periods vs 29). Both exchanges have similar average stock counts when invested. Many Indian companies are listed on both exchanges, but the composition of qualifying stocks differs because of differing listing populations and market microstructure.
Limitations
Cash drag. BSE was in cash for 29 of 51 periods. NSE for 26. The strategy produced zero returns for ten straight years (2000-2009). Investors with shorter time horizons would have abandoned it.
Survivorship bias. Exchange membership uses current company profiles, not historical. Indian exchanges had different compositions in the early 2000s. Delisted companies aren't captured.
Market cap filter in INR. The ₹20B threshold (~$240M USD at 2025 rates) is in Indian Rupees, matching how FMP stores market cap data. This threshold targets liquid mid-cap companies appropriate for India's market structure. In USD terms, this is lower than the $1B threshold used for US exchanges, reflecting different market size distributions across regions.
Liquidity concerns. Some BSE-listed stocks that pass the screen may have thin trading volumes. The backtest assumes frictionless execution at closing prices. Real-world slippage on mid-cap Indian stocks can be material.
No transaction costs or taxes. India's Securities Transaction Tax (STT) and short-term capital gains tax aren't modeled. These reduce realized returns.
Takeaway
QARP didn't produce alpha on Indian exchanges. 9.21% CAGR on BSE and 8.59% on NSE both trail the Sensex's 11.35%. Ten years of cash at the start and frequent cash periods throughout are the main drag.
What QARP did deliver is drawdown protection. BSE's worst drawdown was -17.08%. NSE's was -19.38%. The Sensex hit -51.34%. That's a massive difference for investors who care about downside risk. The Calmar ratio (CAGR / max drawdown) tells the story: BSE's 0.54 vs the Sensex's 0.22. You gave up 2 percentage points of annual return and got a third of the drawdown in exchange.
When the strategy was invested, it worked well. 2020-2024 produced strong excess returns. The problem is the strategy spent too much time in cash, missing extended bull runs. QARP's strict filters are a poor match for a market where valuations run high and quality comes at a premium. In India, the screen is a volatility dampener, not a return enhancer.
Part of a Series
This analysis is part of our QARP global exchange comparison: - QARP on US Stocks (NYSE + NASDAQ + AMEX) - 10.42% CAGR, +2.65% vs S&P 500 - QARP on German Stocks (XETRA) - 8.75% CAGR, +3.69% vs DAX - QARP on Chinese Stocks (SHZ + SHH) - SHH beats SSE Composite - QARP on Hong Kong Stocks (HKSE) - +2.71% vs Hang Seng - QARP: Global Exchange Comparison - full comparison table
Run This Screen Yourself
All metrics used in this analysis (Piotroski scores, ROE, P/E, income quality, debt ratios) are queryable via SQL on Ceta Research. Filter by exchange (BSE or NSE) and see what passes today.
The full backtest code (Python + DuckDB) is available in our GitHub repository.
Data: Ceta Research, FMP financial data warehouse. Universe: BSE + NSE. Benchmark: Sensex. Semi-annual rebalance, equal weight, 2000-2025. All returns in INR.
Past performance does not guarantee future results. This is educational content, not investment advice.


