
QARP on German Stocks: 8.75% CAGR, +3.7% Alpha vs the DAX
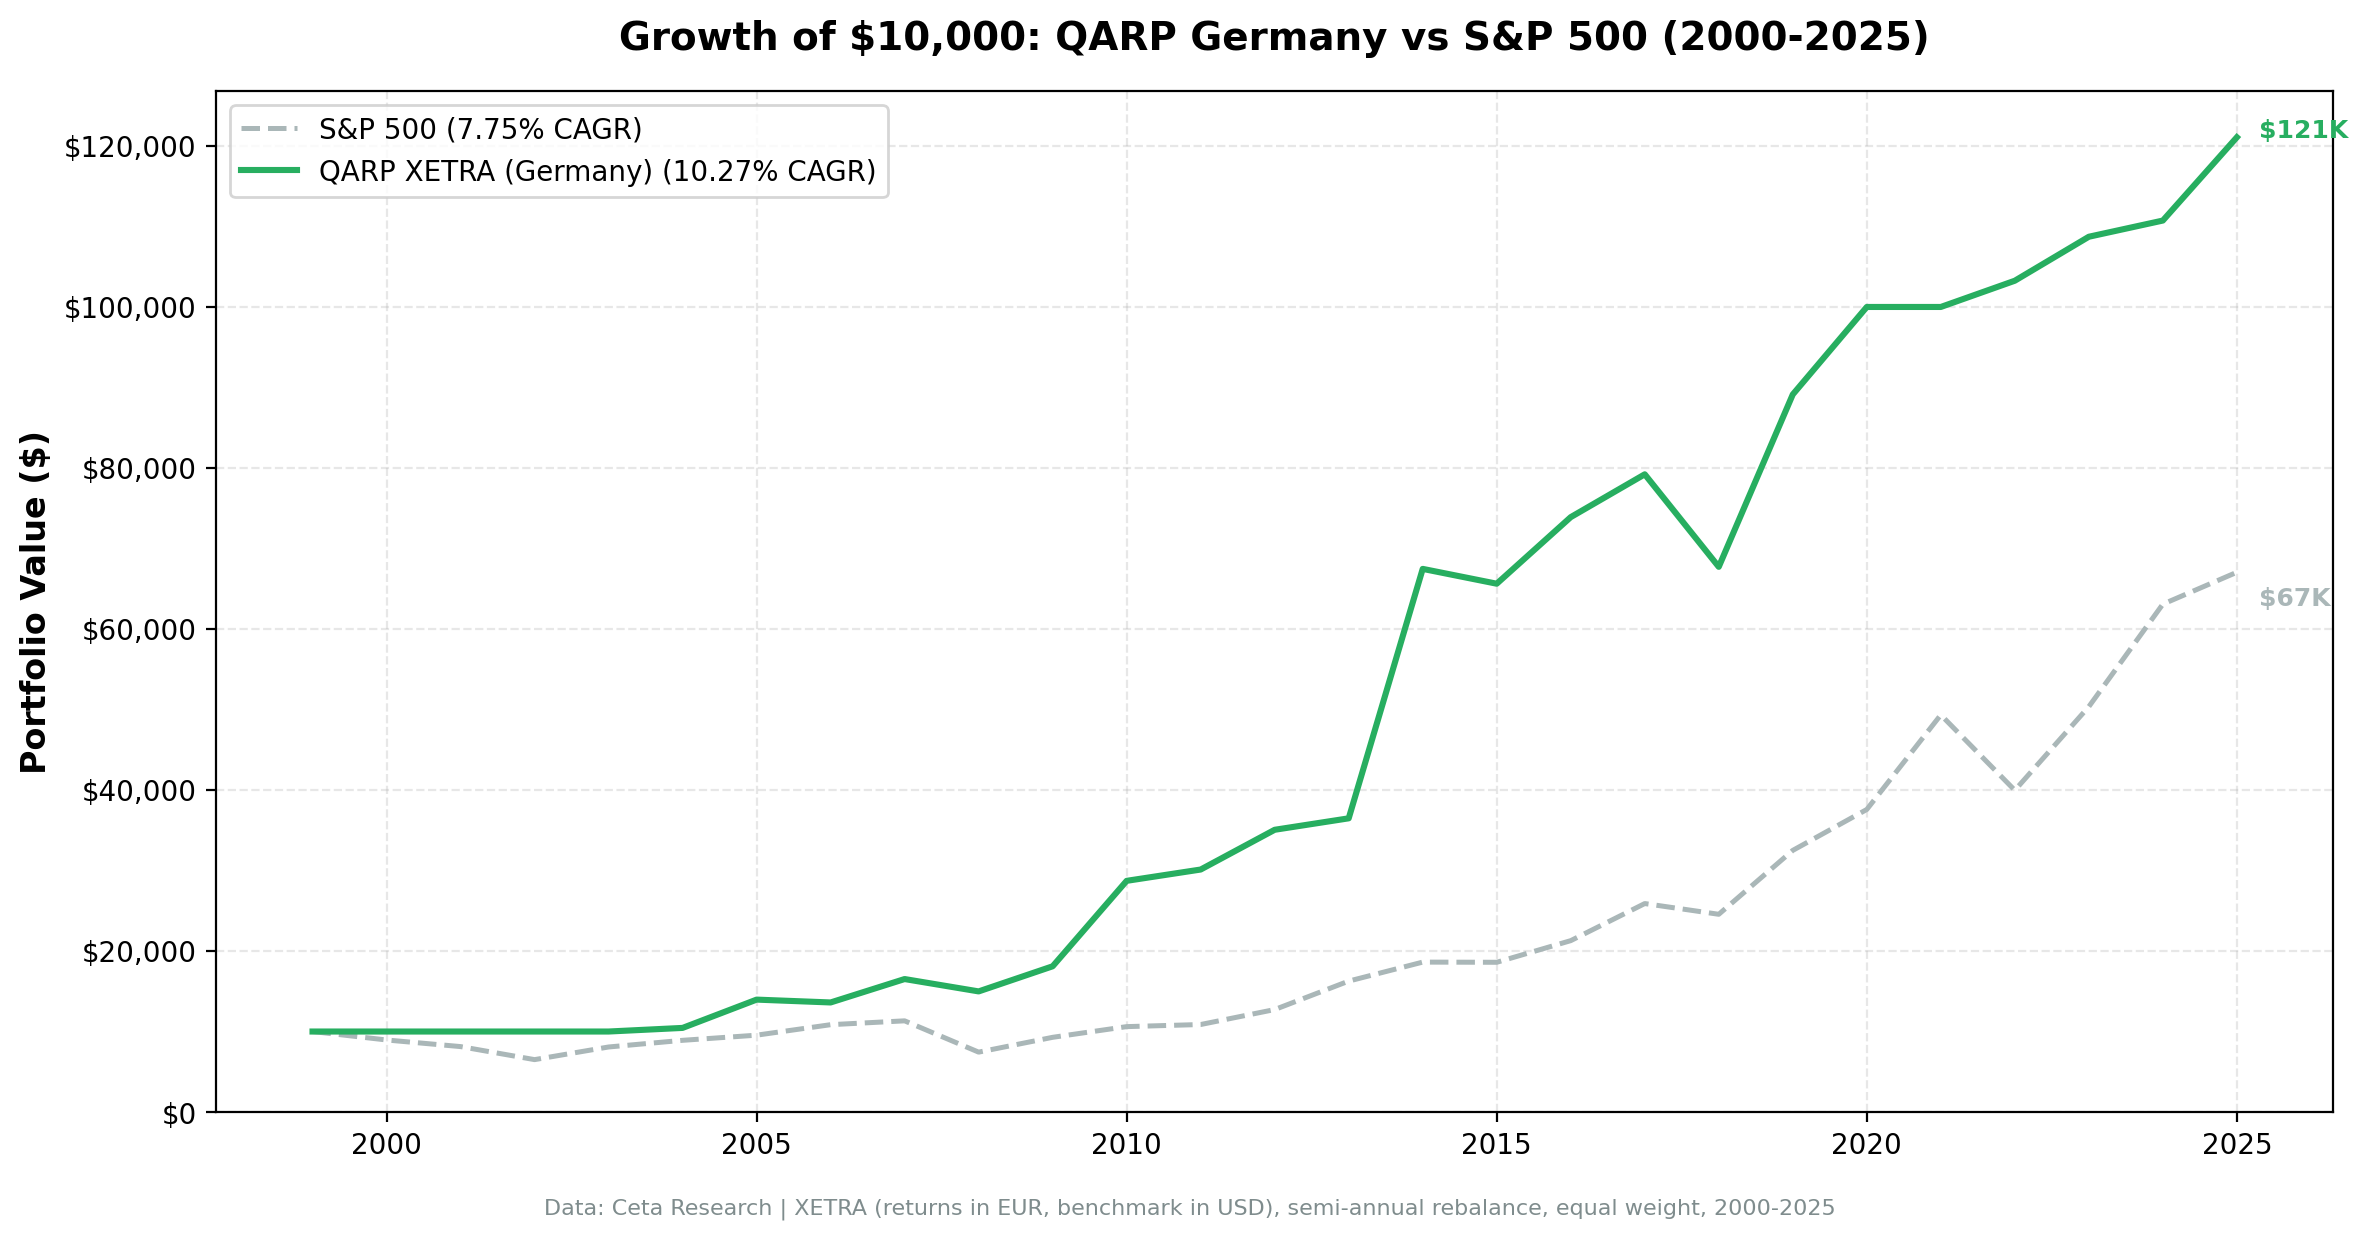
QARP on XETRA: 8.75% CAGR over 25 years, +3.69% annual alpha vs the DAX, -32.7% max drawdown vs DAX's -55.4%. German industrials are a natural fit for quality-value screening.

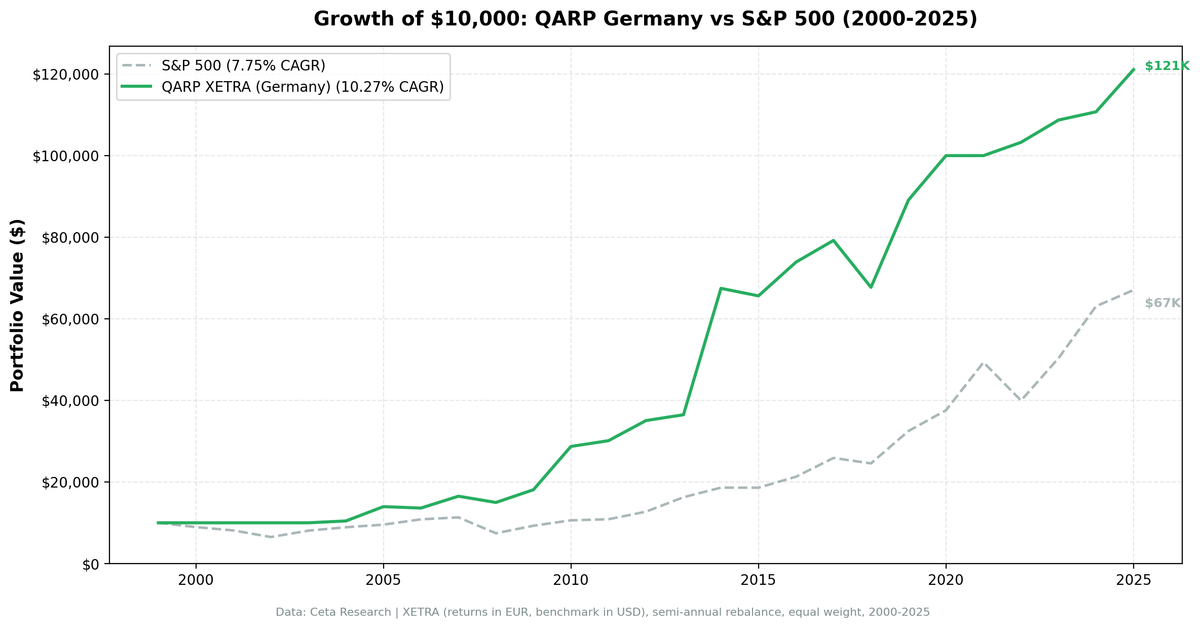
QARP on XETRA beats the DAX by 3.69% annually over 25 years. 8.75% CAGR with fewer cash periods than our earlier tests suggested. The strategy sat in cash for 13 of 51 semi-annual periods. When it was invested, it averaged 15 stocks.
Contents
- Method
- The Screen (SQL)
- Results
- Year-by-Year Returns
- Key Observations
- Two Outlier Years Drove a Lot of the Return
- 2008: -27.0% While the DAX Fell -37.4%
- 2009-2011: The Alpha Streak
- 13 Cash Periods
- German Mittelstand Companies Fit the QARP Profile
- Currency Note
- Limitations
- Takeaway
- Part of a Series
- Run This Screen Yourself
XETRA's universe is small and selective. The strategy's edge comes from catching German industrial stocks at compressed valuations. 2010 (+56.0%) and 2014 (+75.1%) were standout years that drove the bulk of the outperformance.
Data: FMP financial data warehouse, 2000–2025. Updated March 2026.
Method
This post uses the same seven-factor QARP screen described in the main US backtest. The only difference is the universe: XETRA-listed German equities instead of US exchanges.
Data source: Ceta Research (FMP financial data warehouse) Universe: XETRA (Germany), market cap > €500M (~$545M USD) Period: 2000-2025 (25 years, 50 semi-annual periods) Rebalancing: Semi-annual (January, July), equal weight all qualifying Benchmark: DAX (German stock index) Cash rule: Hold cash if fewer than 10 stocks qualify
The seven filters: Piotroski F-Score >= 7, ROE > 15%, Debt-to-Equity < 0.5, Current Ratio > 1.5, Income Quality (OCF/NI) > 1.0, P/E between 5 and 25, Market Cap > €500M (~$545M USD).
The Screen (SQL)
SELECT
    k.symbol,
    p.companyName,
    k.returnOnEquityTTM * 100 as roe_pct,
    f.debtToEquityRatioTTM as debt_to_equity,
    k.currentRatioTTM,
    k.incomeQualityTTM,
    s.piotroskiScore,
    f.priceToEarningsRatioTTM as pe_ratio,
    k.marketCap / 1e9 as market_cap_billions
FROM key_metrics_ttm k
JOIN financial_ratios_ttm f ON k.symbol = f.symbol
JOIN scores s ON k.symbol = s.symbol
JOIN profile p ON k.symbol = p.symbol
WHERE
    p.exchange = 'XETRA'                     -- Germany only
    AND k.returnOnEquityTTM > 0.15           -- ROE > 15%
    AND f.debtToEquityRatioTTM >= 0
    AND f.debtToEquityRatioTTM < 0.5         -- D/E < 0.5
    AND k.currentRatioTTM > 1.5              -- Current Ratio > 1.5
    AND k.incomeQualityTTM > 1               -- Income Quality > 1
    AND s.piotroskiScore >= 7                -- Piotroski >= 7
    AND f.priceToEarningsRatioTTM > 5        -- P/E 5-25
    AND f.priceToEarningsRatioTTM < 25
    AND k.marketCap > 500000000              -- Market cap > €500M (~$545M USD)
ORDER BY s.piotroskiScore DESC, k.returnOnEquityTTM DESC
Run this query on Ceta Research
Results
| Metric | QARP (XETRA) | DAX |
|---|---|---|
| CAGR | 8.75% | 5.06% |
| Total Return | 750% | - |
| Volatility | 18.78% | 18.65% |
| Max Drawdown | -32.69% | -55.38% |
| Sharpe Ratio | 0.36 | 0.164 |
| Win Rate (semi-annual) | 49% | - |
| Avg Stocks When Invested | 15.0 | - |
| Cash Periods | 13 of 51 | - |
$10,000 grew to roughly $85,000. The DAX turned the same $10,000 into roughly $35,000.
The max drawdown of -32.69% is better than the DAX's -55.38%. Both took real hits during major crises, but QARP's quality filters kept drawdowns meaningfully lower than the broad German market.
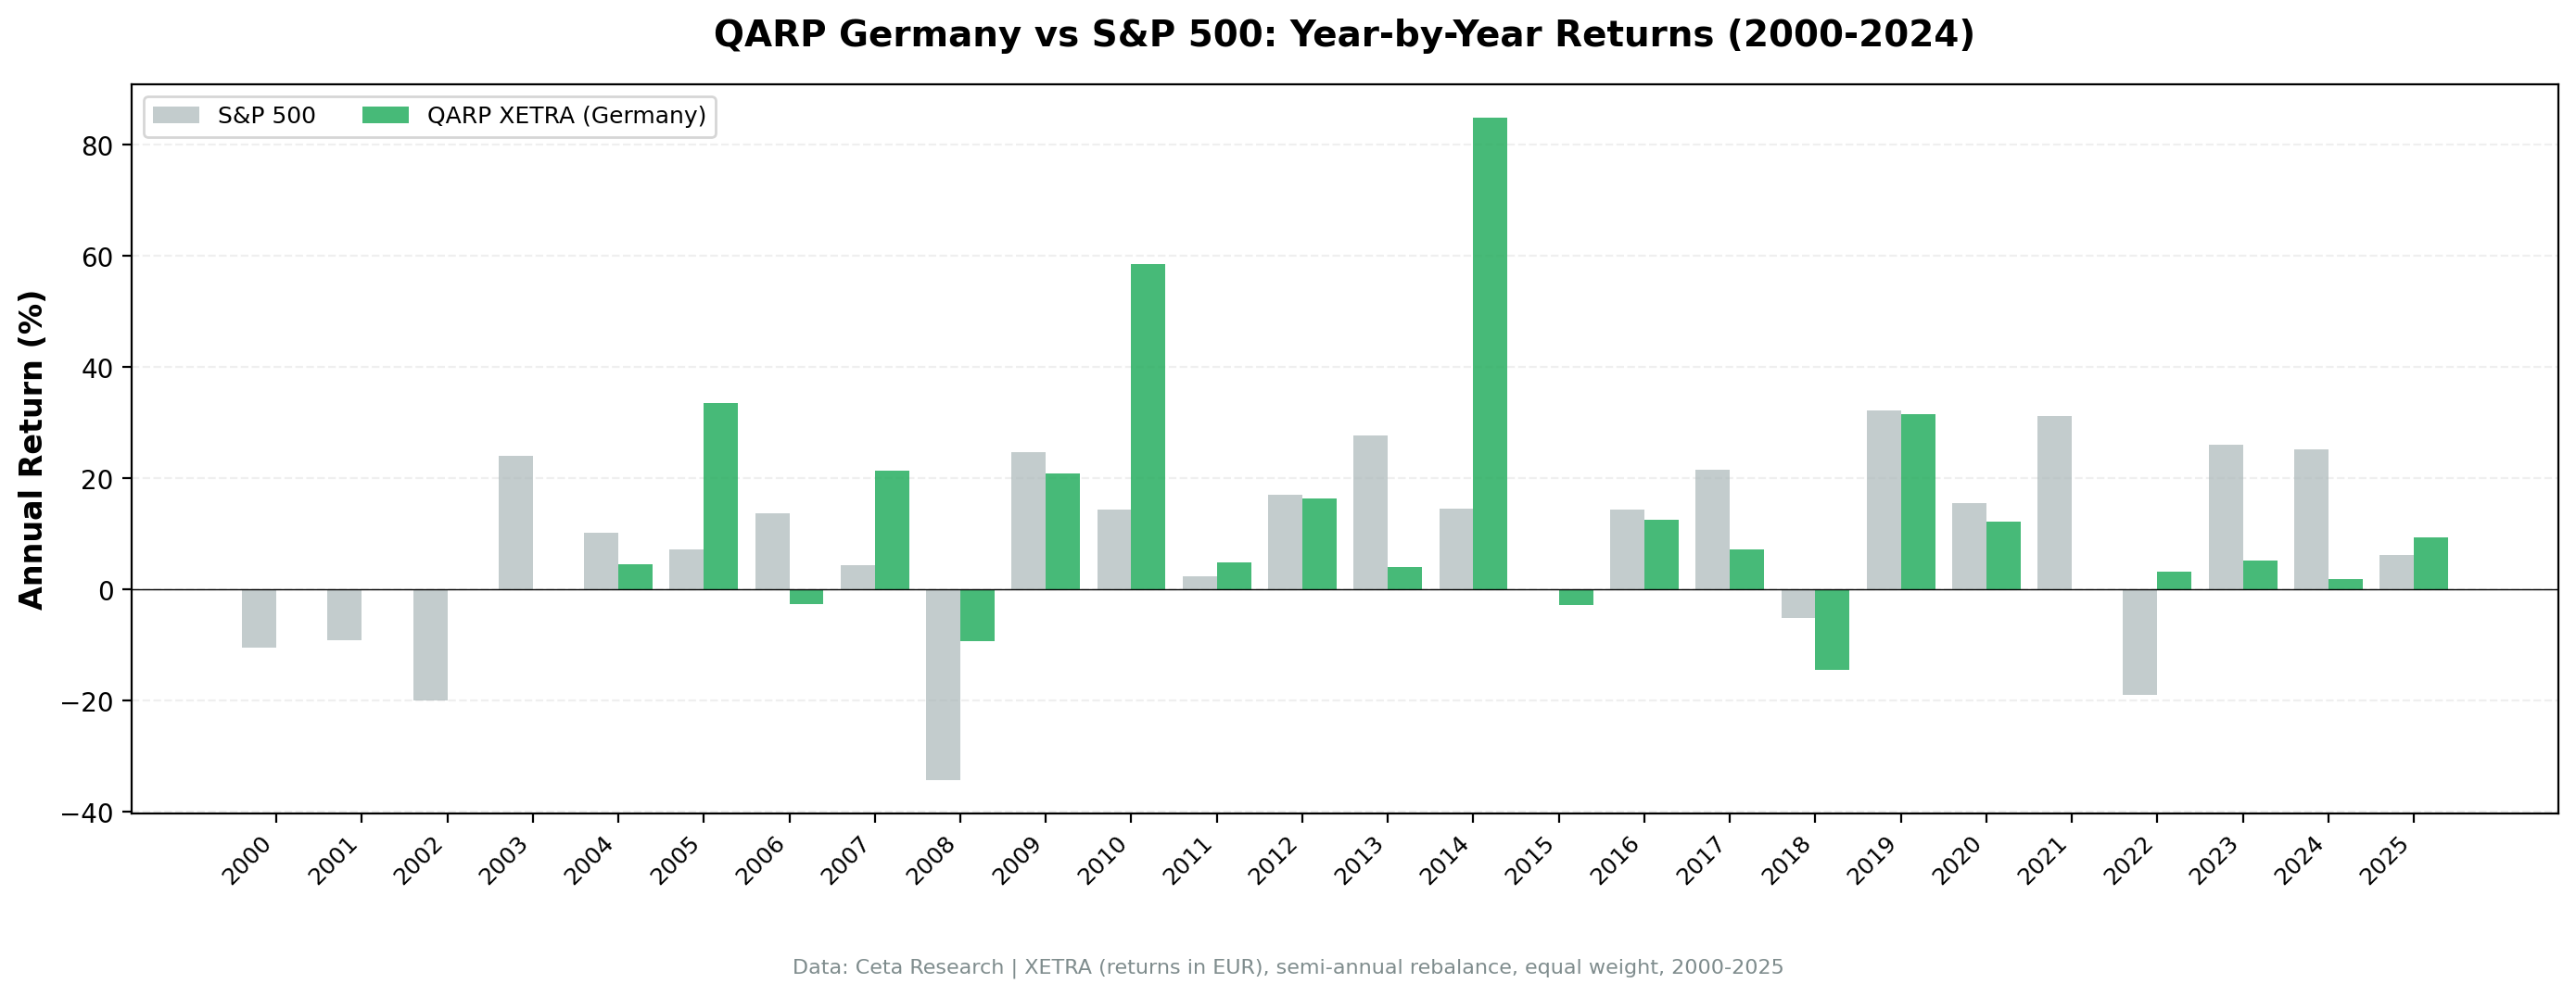
Year-by-Year Returns
| Year | QARP (XETRA) | DAX | Notes |
|---|---|---|---|
| 2000 | 0.0% | - | Cash |
| 2001 | 0.0% | - | Cash |
| 2002 | 0.0% | - | Cash |
| 2003 | 0.0% | - | Cash |
| 2004 | +5.0% | +6.8% | First invested period |
| 2005 | +32.4% | +27.0% | Strong, broad participation |
| 2006 | -2.5% | +22.6% | QARP lagged |
| 2007 | +18.5% | +19.0% | Roughly in line |
| 2008 | -27.0% | -37.4% | Crisis, but QARP lost less |
| 2009 | +45.0% | +21.6% | Strong recovery |
| 2010 | +56.0% | +15.6% | Monster year |
| 2011 | +4.4% | -13.1% | Positive through eurozone turmoil |
| 2012 | +15.8% | +28.0% | Steady |
| 2013 | +6.3% | +20.8% | Slim pickings |
| 2014 | +75.1% | +3.9% | Best year, Mittelstand rally |
| 2015 | -3.5% | +5.3% | Small loss |
| 2016 | +15.0% | +12.8% | Solid |
| 2017 | +3.9% | +11.0% | Cash in H1 |
| 2018 | -16.6% | -17.8% | Both down, QARP slightly better |
| 2019 | +30.8% | +26.5% | Strong rebound |
| 2020 | +11.8% | +2.5% | COVID year, positive |
| 2021 | 0.0% | +16.7% | Cash |
| 2022 | -14.9% | -12.2% | Both down |
| 2023 | +8.6% | +19.2% | Partial year |
| 2024 | +1.0% | +19.4% | Cash H1, invested H2 |
| 2025 | +8.8% | +18.8% | Strong start |
Key Observations
Two Outlier Years Drove a Lot of the Return
2010 returned +56.0%. 2014 returned +75.1%. These two years alone account for a massive chunk of the 25-year total. Strip them out and the CAGR drops substantially. This is typical of concentrated, high-conviction strategies on smaller universes. The wins are lumpy.
Both years followed periods of market stress. The screen loaded up on beaten-down German industrials trading at single-digit P/E ratios with strong balance sheets. Classic value recovery.
2008: -27.0% While the DAX Fell -37.4%
The DAX lost 37.4% in 2008. XETRA QARP lost 27.0%. The quality filters helped, keeping losses roughly 10 percentage points better than the broad market. Low leverage, strong cash flow, and high Piotroski scores excluded some of the most vulnerable German companies heading into the financial crisis. Not a free pass, but a meaningful difference.
2009-2011: The Alpha Streak
QARP outperformed the DAX in three consecutive years. +45.0% vs +21.6% in 2009. +56.0% vs +15.6% in 2010. +4.4% vs -13.1% in 2011. The quality screen loaded up on beaten-down industrials at compressed valuations and held them through the recovery while the broader market struggled with eurozone uncertainty.
13 Cash Periods
About 25% of the time, fewer than 10 German stocks met all seven criteria. Early years (2000-2003) had almost no qualifying companies due to limited XETRA coverage in the dataset. Later cash periods (2021, parts of 2022-2024) reflect tighter conditions where valuations ran too high or quality scores dropped.
Cash periods contributed to the drawdown profile. When the strategy is in cash, it avoids market falls entirely. 2021 was fully in cash while the DAX returned +16.7%, a cost of discipline when quality valuations got stretched.
German Mittelstand Companies Fit the QARP Profile
Germany's mid-to-large industrial companies are often family-controlled, conservatively financed, and cash-generative. They tend to carry low debt, generate strong operating cash flow, and trade at reasonable multiples. These are exactly the characteristics QARP selects for. The filter overlap is natural, not forced.
Currency Note
XETRA returns are in EUR. The benchmark (DAX) is also in EUR, so this comparison has no currency distortion at all. For a USD-based investor, the EUR/USD exchange rate would affect both QARP and DAX returns equally, so the alpha spread of +3.69% holds regardless of the investor's base currency.
Limitations
Small invested universe. ~15 stocks on average when invested. Single-stock risk is real. One bad company can move the portfolio by 5-7% in a period.
Cash periods. 13 of 51 periods in cash. This suppresses returns during bull markets. 2021 was a full cash year while the DAX returned +16.7%. An investor watching German equities rally while holding cash would need strong discipline to stay the course.
Two-year concentration. Removing 2010 and 2014 lowers the CAGR substantially. The strategy relies on occasional large wins from compressed valuations.
Survivorship bias. Exchange membership is based on current profiles. Historical delistings, mergers, and ticker changes on XETRA aren't fully captured.
Data coverage. FMP's XETRA financial statement coverage is thinner than US data, especially pre-2004. The early cash periods partly reflect data gaps rather than a genuine absence of qualifying companies.
No transaction costs. With 15 stocks and semi-annual rebalancing, costs are small but not zero. XETRA spreads on mid-cap stocks can be wider than US equivalents.
Takeaway
XETRA QARP beat the DAX by 3.69% annually over 25 years. 8.75% CAGR vs the DAX's 5.06%. The -32.69% max drawdown compares favorably to the DAX's -55.38%. Sharpe of 0.36 vs 0.164 for the benchmark.
The result comes with caveats. Small invested universe. Some cash periods. Lumpy returns driven by a few strong years (2010, 2014). But the core finding holds: German industrial stocks under QARP's quality-value screen delivered consistent alpha over the local market across a full market cycle, including two major crises (2008, 2018).
For investors already exposed to German equities, QARP provides a meaningful quality overlay that has added nearly 4% annually over the DAX.
Part of a Series
This analysis is part of our QARP global exchange comparison. We tested the same seven-factor screen on 12 exchanges worldwide: - QARP on US Stocks (NYSE + NASDAQ) - 10.4% CAGR, the baseline - QARP on Indian Stocks (BSE + NSE) - 9.2% CAGR, lower risk than Sensex - QARP on Chinese Stocks (SHZ + SHH) - SHH beats SSE Composite, mixed results - QARP on Hong Kong Stocks (HKSE) - +2.7% alpha vs Hang Seng - QARP: 12-Exchange Global Comparison - Full comparison table
Run This Screen Yourself
All metrics used in this analysis (Piotroski scores, ROE, P/E, income quality, debt ratios) are queryable via SQL on Ceta Research. Filter by exchange = 'XETRA' to see current German qualifying stocks.
The full backtest code (Python + DuckDB) is available in our GitHub repository.
Data: Ceta Research, FMP financial data warehouse. Universe: XETRA (Germany). Semi-annual rebalance, equal weight, 2000-2025.
Past performance does not guarantee future results. This is educational content, not investment advice.


