
QARP on Hong Kong Stocks: +2.7% Alpha in a Tough Market
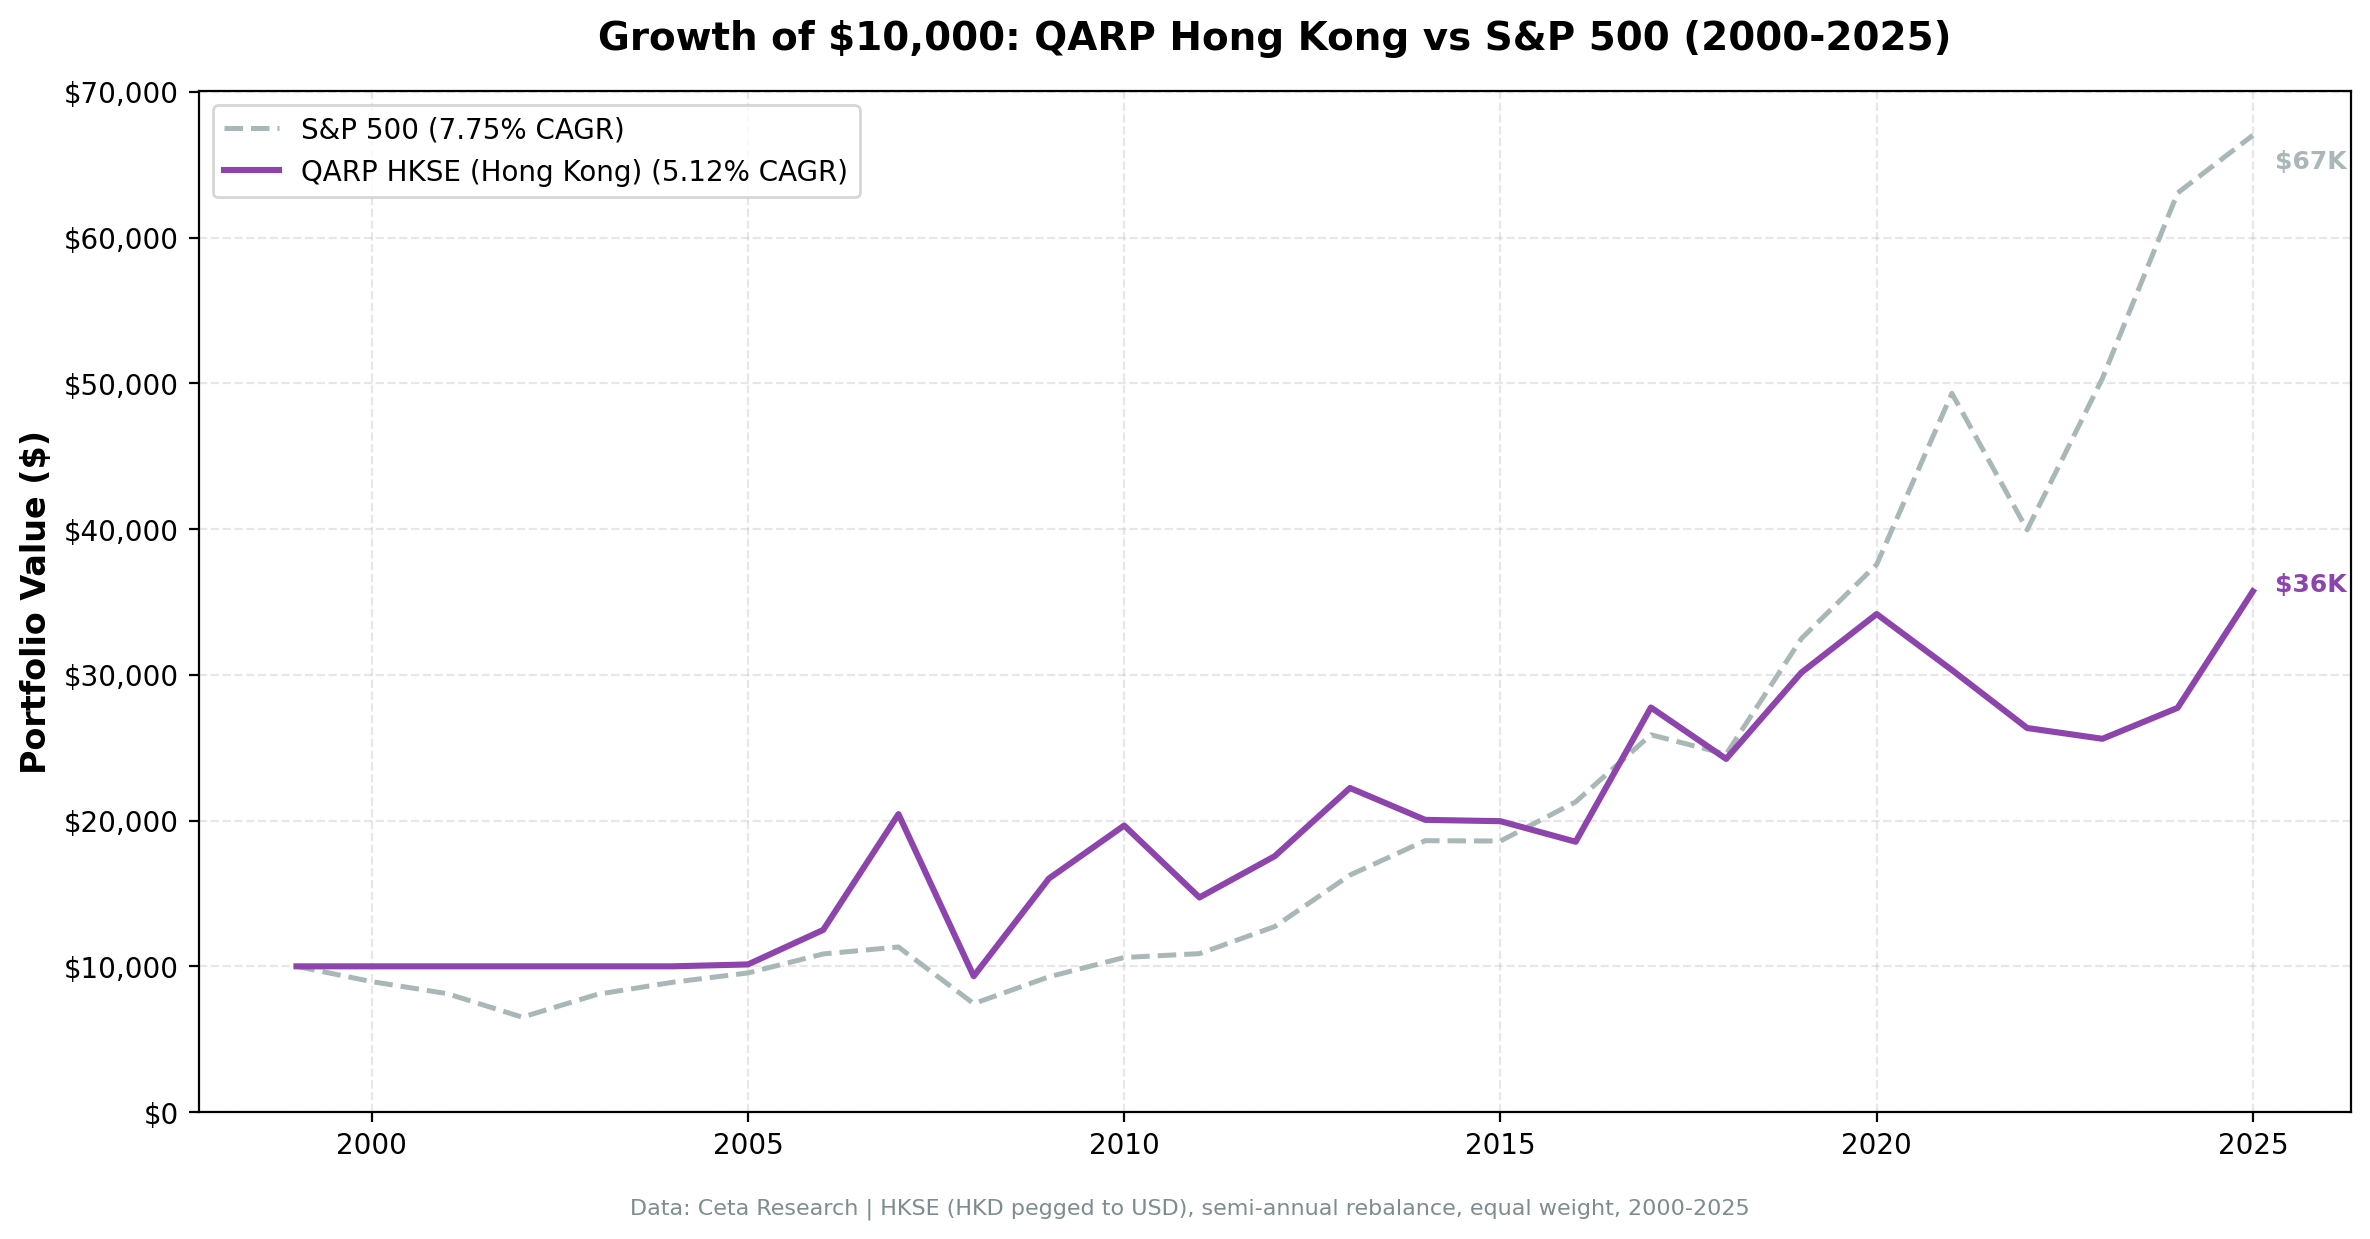
QARP returned 4.02% annually on Hong Kong stocks, beating the Hang Seng's 1.31% by +2.71% per year. The absolute returns are modest, but the quality screen adds real alpha over the local market.

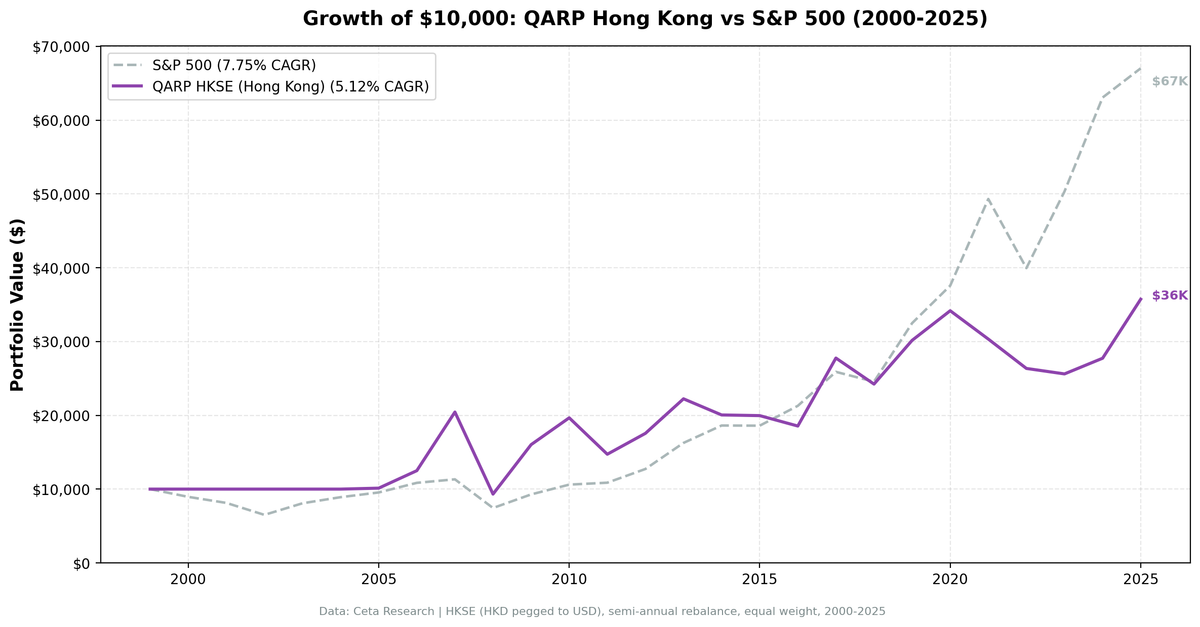
QARP on Hong Kong stocks returned 4.02% annually, beating the Hang Seng's 1.31% by 2.71% per year. The absolute returns are modest. But the local market was the problem, not the screen. QARP found real quality companies and generated meaningful alpha over the index in a market that barely grew over 25 years.
Contents
- Method
- The Screen (SQL)
- What We Found
- 4.02% CAGR. +2.71% excess return vs the Hang Seng.
- Year-by-year returns
- The boom-bust cycle
- 2021-2023: QARP lost money, but less than the Hang Seng
- Why Hong Kong Underperforms (in Absolute Terms)
- Coverage and Cash Periods
- Limitations
- Takeaway
- Part of a Series
- Run This Screen Yourself
A -52.69% max drawdown and a 0.047 Sharpe ratio reflect the difficulty of Hong Kong equities as an asset class. The strategy sat in cash for 16 of 51 semi-annual periods. When invested, it averaged 13 stocks.
Data: FMP financial data warehouse, 2000–2025. Updated March 2026.
Method
Data source: Ceta Research (FMP financial data warehouse) Universe: HKSE, market cap > HK$2B (~$256M USD) Period: 2000-2025 (25 years, 50 semi-annual periods) Rebalancing: Semi-annual (January, July), equal weight all qualifying Benchmark: Hang Seng Index Cash rule: Hold cash if fewer than 10 stocks qualify Currency: HKD is pegged to USD (7.75-7.85 range), so there's no currency distortion in the returns. What you see is what you get.
Signal: Piotroski >= 7, ROE > 15%, D/E < 0.5, CR > 1.5, IQ (OCF/NI) > 1.0, P/E 5-25, MCap > HK$2B (~$256M USD)
The Screen (SQL)
SELECT
    k.symbol,
    p.companyName,
    k.returnOnEquityTTM * 100 as roe_pct,
    f.debtToEquityRatioTTM as debt_to_equity,
    k.currentRatioTTM,
    k.incomeQualityTTM,
    s.piotroskiScore,
    f.priceToEarningsRatioTTM as pe_ratio,
    k.marketCap / 1e9 as market_cap_billions
FROM key_metrics_ttm k
JOIN financial_ratios_ttm f ON k.symbol = f.symbol
JOIN scores s ON k.symbol = s.symbol
JOIN profile p ON k.symbol = p.symbol
WHERE
    p.exchange = 'HKSE'                      -- Hong Kong only
    AND k.returnOnEquityTTM > 0.15           -- ROE > 15%
    AND f.debtToEquityRatioTTM >= 0
    AND f.debtToEquityRatioTTM < 0.5         -- D/E < 0.5
    AND k.currentRatioTTM > 1.5              -- Current Ratio > 1.5
    AND k.incomeQualityTTM > 1               -- Income Quality > 1
    AND s.piotroskiScore >= 7                -- Piotroski >= 7
    AND f.priceToEarningsRatioTTM > 5        -- P/E 5-25
    AND f.priceToEarningsRatioTTM < 25
    AND k.marketCap > 2000000000             -- Market cap > HK$2B (~$256M USD)
ORDER BY s.piotroskiScore DESC, k.returnOnEquityTTM DESC
Run this query on Ceta Research
What We Found
4.02% CAGR. +2.71% excess return vs the Hang Seng.
| Metric | QARP (HKSE) | Hang Seng |
|---|---|---|
| CAGR | 4.02% | 1.31% |
| Total Return | 173% | - |
| Volatility | 21.81% | - |
| Max Drawdown | -52.69% | -46.08% |
| Sharpe Ratio | 0.047 | -0.085 |
| Win Rate (semi-annual) | 51% | - |
| Avg Stocks per Period | 13.1 | - |
| Cash Periods | 16 of 51 | - |
QARP turned $10,000 into roughly $27,300. The Hang Seng turned it into roughly $14,000. The Sharpe ratios are low for both, but QARP's 0.047 is at least positive. The Hang Seng's -0.085 means the index delivered negative risk-adjusted returns over the full period.
The screen averaged 13 stocks per rebalance, just above the 10-stock cash threshold. 16 cash periods out of 51 is noticeable, but the main story is that even in a market that went almost nowhere, QARP added value.
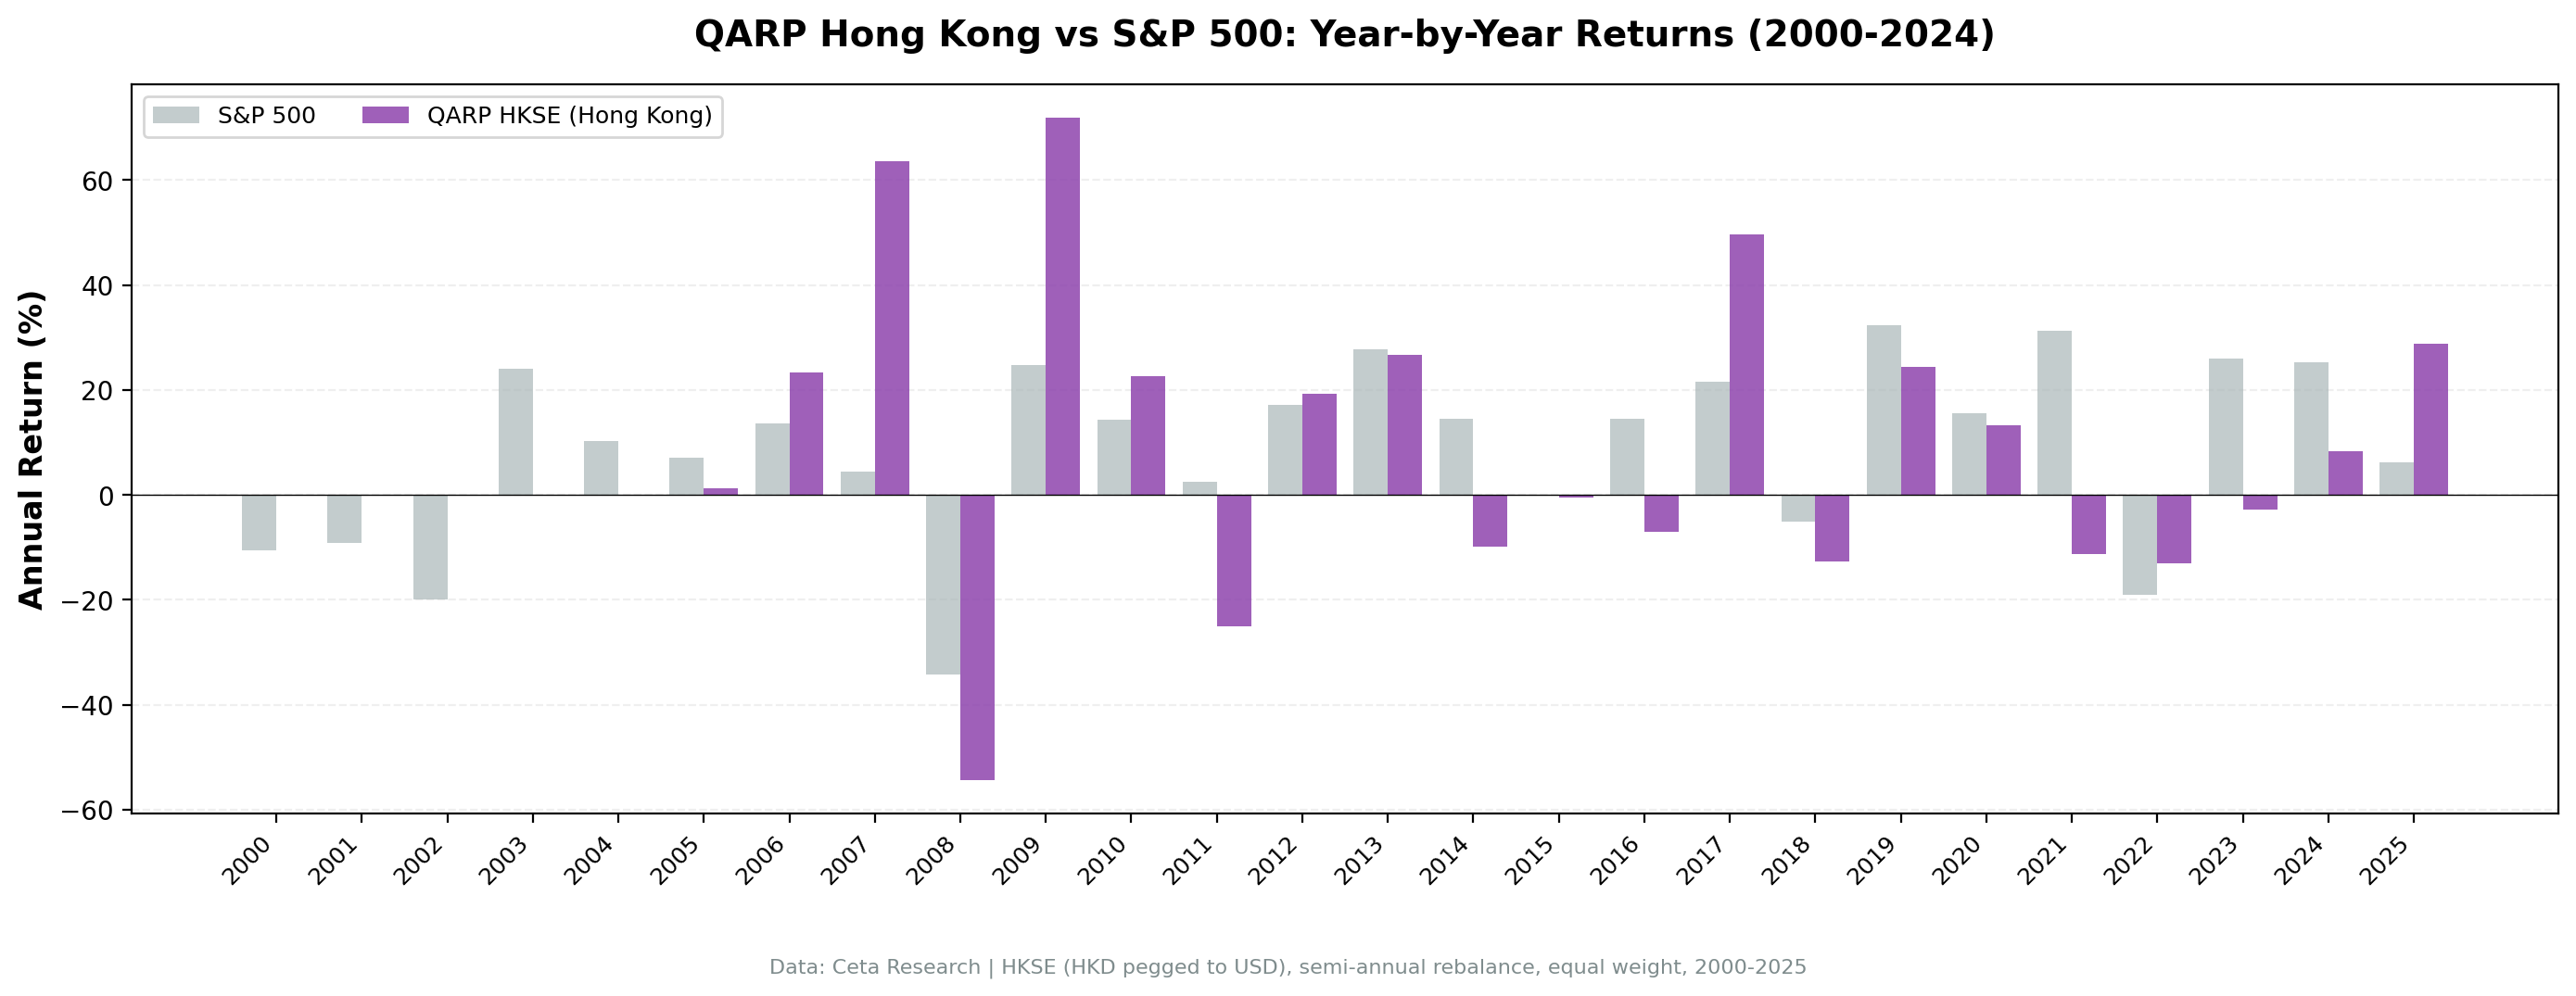
Year-by-year returns
| Year | QARP (HKSE) | Hang Seng | Notes |
|---|---|---|---|
| 2000 | 0.0% | - | Cash |
| 2001 | 0.0% | - | Cash |
| 2002 | 0.0% | - | Cash |
| 2003 | 0.0% | - | Cash |
| 2004 | 0.0% | - | Cash |
| 2005 | +2.5% | +5.0% | First invested period |
| 2006 | +9.2% | +35.9% | China growth story, QARP lagged |
| 2007 | +73.8% | +35.7% | Pre-crisis euphoria, QARP doubled the index |
| 2008 | -52.7% | -45.4% | Global financial crisis |
| 2009 | +64.0% | +45.1% | Recovery boom |
| 2010 | +15.1% | +7.4% | Continued recovery |
| 2011 | -25.0% | -19.4% | European debt crisis spillover |
| 2012 | +21.3% | +23.5% | |
| 2013 | +19.3% | +0.1% | QARP crushed the index |
| 2014 | -7.9% | +2.2% | Occupy Central protests |
| 2015 | +1.2% | -10.6% | QARP positive while index fell |
| 2016 | -3.6% | +3.9% | |
| 2017 | +32.9% | +37.8% | Strong bull market |
| 2018 | -15.9% | -17.6% | Trade war begins |
| 2019 | +21.5% | +13.6% | |
| 2020 | +13.4% | -3.8% | COVID year, QARP stayed positive |
| 2021 | -8.3% | -15.3% | China tech crackdown, QARP lost less |
| 2022 | -10.5% | -13.4% | Geopolitical tensions, QARP lost less |
| 2023 | -14.3% | -16.7% | Continued outflows, QARP lost less |
| 2024 | +9.7% | +16.9% | Partial recovery |
| 2025 | +35.6% | +23.4% | Strong start |
The boom-bust cycle
Hong Kong's returns are defined by two patterns: violent swings and long stretches of disappointment.
2007 (+73.8%) and 2009 (+64.0%) are the standouts. Both are classic emerging market booms fueled by China growth expectations and global liquidity. The problem: 2008 sits between them at -52.7%. You needed an iron stomach to hold through that drawdown and capture the recovery. Most investors don't.
The 2005-2010 stretch looks great on paper. QARP went from cash to a five-year run that included a 73.8% year. But the sequence matters. Someone who started in January 2007 would have been down sharply by mid-2008 before the recovery kicked in.
2021-2023: QARP lost money, but less than the Hang Seng
| Year | QARP (HKSE) | Hang Seng | Difference |
|---|---|---|---|
| 2021 | -8.3% | -15.3% | +7.0% |
| 2022 | -10.5% | -13.4% | +2.9% |
| 2023 | -14.3% | -16.7% | +2.4% |
Three consecutive negative years for both QARP and the Hang Seng. The market-level forces were overwhelming: China's tech crackdown, zero-COVID policy, Taiwan tensions, and sustained capital outflows. These aren't junk companies failing. QARP's filters ensured they had strong balance sheets, high ROE, cash-backed earnings.
Quality didn't prevent losses, but it reduced them. QARP beat the Hang Seng in all three years. The +7% gap in 2021 is the largest, likely because QARP's screens excluded the worst-hit tech names that dragged the index down.
Why Hong Kong Underperforms (in Absolute Terms)
Four structural issues explain why the market itself delivers low returns, even though QARP adds value relative to it.
China exposure without China upside. Most large-cap HKSE stocks are mainland Chinese companies listed in Hong Kong (H-shares, red chips). They carry full China regulatory and economic risk. But unlike Shanghai or Shenzhen listings, they don't benefit from domestic Chinese capital flows or government support programs like the National Team buying.
The HKD peg removes the currency cushion. Many emerging markets get a boost from currency depreciation (their local-currency returns look better in USD terms) or benefit from a weakening currency that helps exporters. Hong Kong doesn't get this. The HKD peg to USD means low returns are real, not a currency artifact.
Regulatory risk from the mainland. Beijing's 2021 crackdown on tech, education, and fintech companies destroyed hundreds of billions in market value on HKSE-listed stocks. QARP's filters can identify operationally strong companies, but they can't predict regulatory decrees that reshape entire industries overnight.
Declining liquidity. Chinese companies increasingly prefer listing on Shanghai's STAR Market or Shenzhen's ChiNext board. Hong Kong's share of Chinese IPOs has fallen steadily. Lower liquidity means wider spreads, less analyst coverage, and more volatile price discovery for the companies that remain.
Coverage and Cash Periods
The first five years (2000-2004) were entirely cash. The HKSE didn't have enough qualifying stocks above HK$2B market cap that passed all seven filters. This isn't surprising. Hong Kong's large-cap universe was smaller in the early 2000s, and many companies carried high leverage.
From 2005 onward, the screen found enough stocks to stay invested most of the time. The portfolio averaged 13 stocks per rebalance. Thin, but functional. The 16 total cash periods include the early data gap and some later periods where valuations pushed past the P/E ceiling.
Limitations
Small sample. 13 stocks per period is low. Single-stock blowups have outsized impact.
Survivorship bias. We use current exchange membership, not historical. Delistings (especially forced ones after regulatory action) aren't captured.
No transaction costs. Hong Kong stamp duty (0.13% each way) is higher than most exchanges. Real returns would be lower.
Concentrated sectors. With only 13 qualifying stocks, sector concentration risk is high. A few property developers or conglomerates can dominate the portfolio.
Takeaway
QARP works in Hong Kong, at least relative to the local market. 4.02% CAGR beats the Hang Seng's 1.31% by 2.71% annually. The quality screen finds companies with strong fundamentals, low leverage, cash-backed earnings, and those companies outperform the index.
The absolute returns are low because the market itself is tough. A 0.047 Sharpe ratio isn't going to excite anyone. But the Hang Seng's Sharpe is negative (-0.085), which puts QARP's relative contribution in perspective. The same filters that produce strong results on US and Indian stocks generate meaningful alpha in Hong Kong too. The market-level headwinds just cap the absolute outcome.
Hong Kong shows that factor screening can add value even in structurally challenged markets. QARP didn't save you from losing money in 2021-2023, but it lost less than the index every single year. Over 25 years, that compounds into a meaningful gap.
Part of a Series
This analysis is part of our QARP global exchange comparison. We tested the same seven-factor screen on 12 exchanges worldwide: - QARP on US Stocks (NYSE + NASDAQ) - 10.4% CAGR, the baseline - QARP on Indian Stocks (BSE + NSE) - 9.2% CAGR, lower risk than Sensex - QARP on German Stocks (XETRA) - 8.75% CAGR, +3.7% alpha vs DAX - QARP on Chinese Stocks (SHZ + SHH) - SHH beats SSE Composite, mixed results - QARP: 12-Exchange Global Comparison - Full comparison table
Run This Screen Yourself
All metrics used in this analysis (Piotroski scores, ROE, P/E, income quality, debt ratios) are queryable via SQL on Ceta Research. The QARP screen SQL works on any exchange. Filter by exchangeShortName = 'HKSE' to replicate.
The full backtest code (Python + DuckDB) is available in our GitHub repository.
Data: Ceta Research, FMP financial data warehouse. Universe: HKSE. Semi-annual rebalance, equal weight, 2000-2025.
Past performance does not guarantee future results. This is educational content, not investment advice.


