
Working Capital Efficiency in the UK: 6.2% CAGR vs the FTSE 100's 1.1% Over 25 Years
The UK produced strong excess returns for working capital efficiency. 6.17% CAGR vs 1.13% for the FTSE 100. +5.04% annual excess and a 68% win rate over 25 years.

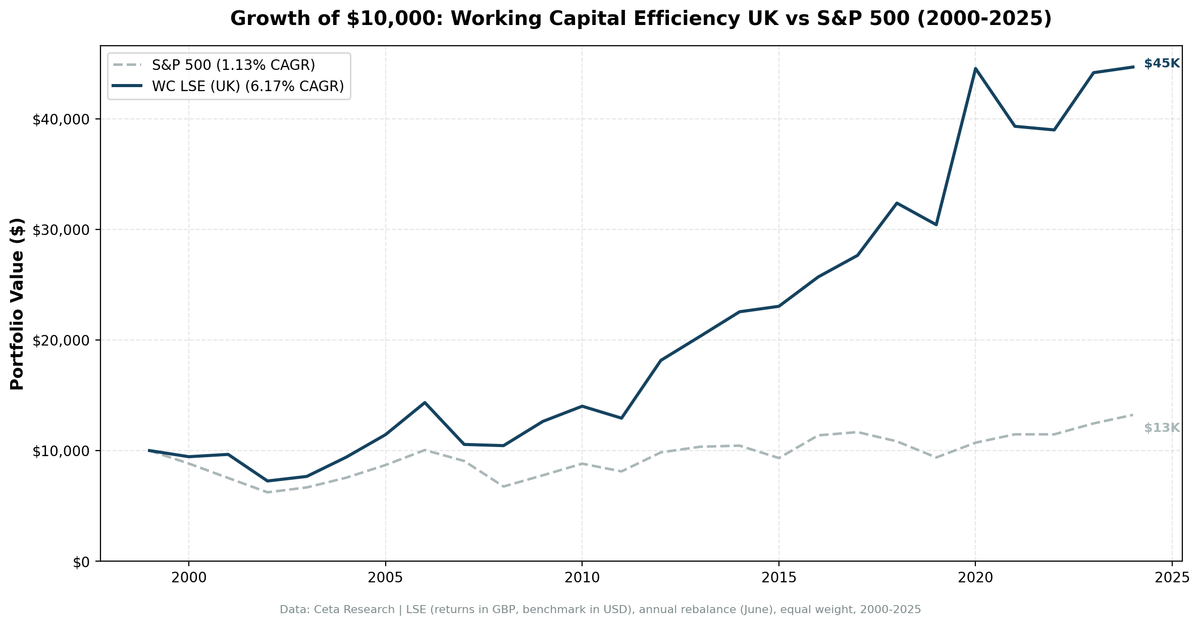
The UK produced strong excess returns for working capital efficiency. Over 25 years, a portfolio of the UK's most capital-efficient companies returned 6.17% CAGR. The FTSE 100 returned 1.13% over the same period. That's +5.04% annual excess and a 68% win rate (17 out of 25 years beat the index).
Contents
- Why the UK?
- Methodology
- The Numbers
- What Drove the Returns
- When It Struggles
- The Flat Benchmark Question
- Run It Yourself
- Limitations
- Part of a Series
The FTSE 100 has been one of the weakest major indices globally since 2000. A flat benchmark makes the screen look better. But 17 out of 25 winning years and a total return of 347% vs 32% for the FTSE 100 tell a real story about quality stock selection in the UK market.
Data: FMP financial data warehouse, 2000–2025. Updated April 2026.
Why the UK?
The London Stock Exchange has deep coverage across sectors: financials, energy, consumer staples, healthcare, industrials, and technology. Working capital efficiency screens work best in diversified markets where the signal can differentiate quality operators from the broad index.
The FTSE 100 is heavily weighted toward slow-growth sectors (energy, mining, banking, tobacco). Over the past 25 years, the index barely grew in price terms. Dividends added meaningful return, but the price index stagnated. A quality screen that picks capital-efficient mid-caps and avoids the index's heavy weighting in capital-intensive sectors naturally outperforms in this environment.
The UK also had thinner mid-cap coverage relative to the US through much of this period. Less analyst attention means more mispricing for quality signals.
Methodology
Universe: LSE (London Stock Exchange) Period: 2000-2025 (25 years, 25 annual periods) Portfolio: Top 30 by WC/Revenue ASC, equal weight. Cash if fewer than 10 qualify. Rebalancing: Annual (June) Costs: Size-tiered transaction costs applied Point-in-time: 45-day lag on financial data Benchmark: FTSE 100 (^FTSE). Both portfolio and benchmark returns are in GBP, making the comparison currency-neutral. Execution: MOC (market-on-close, next-day). Signal generated from prior-close data, trades execute at the following close. Data: Ceta Research (FMP financial data warehouse)
Signal SQL:
WITH bs AS (
  SELECT b.* FROM balance_sheet b
  JOIN (SELECT symbol, MAX(date) AS max_d
        FROM balance_sheet WHERE period = 'FY' GROUP BY symbol) lat
    ON b.symbol = lat.symbol AND b.date = lat.max_d
  WHERE b.period = 'FY'
),
inc AS (
  SELECT i.* FROM income_statement i
  JOIN (SELECT symbol, MAX(date) AS max_d
        FROM income_statement WHERE period = 'FY' GROUP BY symbol) lat
    ON i.symbol = lat.symbol AND i.date = lat.max_d
  WHERE i.period = 'FY'
),
km AS (
  SELECT k.* FROM key_metrics_ttm k
  JOIN (SELECT symbol, MAX(fetchedAtEpoch) AS max_e
        FROM key_metrics_ttm GROUP BY symbol) lat
    ON k.symbol = lat.symbol AND k.fetchedAtEpoch = lat.max_e
),
fr AS (
  SELECT f.* FROM financial_ratios_ttm f
  JOIN (SELECT symbol, MAX(fetchedAtEpoch) AS max_e
        FROM financial_ratios_ttm GROUP BY symbol) lat
    ON f.symbol = lat.symbol AND f.fetchedAtEpoch = lat.max_e
)
SELECT bs.symbol, p.companyName, p.exchange,
    ROUND((bs.totalCurrentAssets - bs.totalCurrentLiabilities)
        / inc.revenue, 3) AS wc_to_revenue,
    ROUND(km.returnOnEquityTTM * 100, 1) AS roe_pct,
    ROUND(fr.operatingProfitMarginTTM * 100, 1) AS opm_pct,
    ROUND(km.marketCap / 1e9, 2) AS mktcap_b
FROM bs
JOIN inc ON bs.symbol = inc.symbol
JOIN profile p ON bs.symbol = p.symbol
JOIN km ON bs.symbol = km.symbol
JOIN fr ON bs.symbol = fr.symbol
WHERE bs.totalCurrentAssets > bs.totalCurrentLiabilities
  AND (bs.totalCurrentAssets - bs.totalCurrentLiabilities)
      / inc.revenue < 0.50
  AND inc.revenue > 0
  AND km.returnOnEquityTTM > 0.08
  AND fr.operatingProfitMarginTTM > 0.10
  AND km.marketCap > 500000000
  AND p.exchange IN ('LSE')
ORDER BY wc_to_revenue ASC
LIMIT 30
The Numbers
| Metric | WC UK | FTSE 100 |
|---|---|---|
| CAGR | 6.17% | 1.13% |
| Excess CAGR | +5.04% | -- |
| Sharpe Ratio | 0.155 | -0.181 |
| Max Drawdown | -27.50% | -37.75% |
| Total Return | 347% | 32% |
| Down Capture | 43% | -- |
| Up Capture | 142% | -- |
| Win Rate | 68% | -- |
Zero cash periods. The portfolio was fully invested in all 25 years, averaging 11.0 stocks. The smaller portfolio size reflects the UK market's narrower pool of qualifying companies after data quality filters.
The 43% down capture means the portfolio captured less than half of the FTSE 100's downside while gaining 142% of its upside. The FTSE 100's negative Sharpe ratio (-0.181) tells the story of a weak index. The working capital screen delivered positive risk-adjusted returns where the index didn't.
Annual returns:
| Year | Portfolio | FTSE 100 | Excess |
|---|---|---|---|
| 2000 | -5.5% | -11.7% | +6.2% |
| 2001 | +2.2% | -14.8% | +17.0% |
| 2002 | -24.9% | -17.2% | -7.7% |
| 2003 | +5.7% | +7.1% | -1.4% |
| 2004 | +22.7% | +13.2% | +9.5% |
| 2005 | +21.7% | +15.2% | +6.5% |
| 2006 | +25.4% | +15.6% | +9.8% |
| 2007 | -26.4% | -9.8% | -16.5% |
| 2008 | -1.0% | -25.5% | +24.4% |
| 2009 | +21.0% | +15.1% | +5.9% |
| 2010 | +10.9% | +13.5% | -2.6% |
| 2011 | -7.7% | -7.9% | +0.2% |
| 2012 | +40.4% | +21.2% | +19.2% |
| 2013 | +12.0% | +5.2% | +6.8% |
| 2014 | +10.9% | +0.9% | +9.9% |
| 2015 | +2.2% | -10.7% | +12.9% |
| 2016 | +11.5% | +22.0% | -10.5% |
| 2017 | +7.6% | +2.6% | +5.0% |
| 2018 | +17.1% | -7.2% | +24.3% |
| 2019 | -6.0% | -13.4% | +7.4% |
| 2020 | +46.4% | +14.3% | +32.1% |
| 2021 | -11.7% | +7.0% | -18.8% |
| 2022 | -0.8% | -0.0% | -0.8% |
| 2023 | +13.3% | +8.6% | +4.7% |
| 2024 | +1.1% | +6.2% | -5.0% |
17 of 25 years of positive excess. The negative years include 2002 (-7.7%), 2007 (-16.5%), 2016 (-10.5%), and 2021 (-18.8%). The strategy's weakness is concentrated in periods where the FTSE 100's heavy commodity/financial weighting was rewarded.
What Drove the Returns
2001: dotcom resilience. +2.2% in 2001 while the FTSE dropped 14.8%. UK quality companies with lean working capital held their value while the broader index collapsed.
2004-2006: sustained compounding. Three consecutive years of strong excess: +9.5%, +6.5%, +9.8%. The UK economy was growing, and quality companies with efficient operations outperformed the FTSE 100's heavy weighting in banks and oil.
The financial crisis (2008). -1.0% vs -25.5% for the FTSE 100. The portfolio barely moved while the index lost a quarter of its value. That +24.4% excess is one of the best crisis-year results across all exchanges.
COVID recovery (2020). +46.4% vs +14.3%. The best single-year outperformance in the dataset. Quality companies bounced hard.
2018: resilience during Brexit uncertainty. +17.1% vs -7.2%. While the FTSE 100 fell, the quality screen delivered +24.3% excess.
When It Struggles
2007: pre-crisis collapse. -26.4% vs -9.8% for the FTSE 100. The portfolio's smaller, more concentrated holdings were hit harder in the initial credit crunch. This was the worst single year for excess returns at -16.5%.
2016: the Brexit rally. +11.5% vs +22.0% for the FTSE 100. After the Brexit vote, GBP crashed and multinational FTSE 100 companies (earning in USD/EUR) surged on the currency effect. The quality screen held domestically-oriented companies that didn't benefit from the weaker pound.
2021: post-COVID rotation. -11.7% vs +7.0%. The market rotated into cyclical and value stocks (energy, mining, banks) that the quality screen had underweighted.
The strategy's weakness is concentrated in periods where the FTSE 100's heavy commodity/financial weighting was rewarded, or when concentrated portfolios amplify losses.
The Flat Benchmark Question
The FTSE 100 returned 1.13% CAGR over 25 years in price terms. That's almost nothing. So is the +5.04% excess just an artifact of a weak benchmark?
Partially. A strong benchmark would compress the excess. Against SPY (7.64% CAGR), the UK portfolio's 6.17% CAGR would show -1.47% excess.
But the argument isn't just about excess return. The portfolio's absolute 6.17% CAGR and 347% total return beat the FTSE 100's 32% by a wide margin. The strategy picked quality companies in a market where the index was dominated by slow-growth giants. That's the value of stock selection: the signal found what the index couldn't deliver.
Run It Yourself
# Live screen (current UK stocks)
python3 working-capital/screen.py --preset uk

# Historical backtest
python3 working-capital/backtest.py --preset uk --output results/uk.json --verbose
Limitations
Weak benchmark flatters the excess. The FTSE 100's 1.13% CAGR makes any reasonable stock-picking strategy look good. The +5.04% excess partly reflects a benchmark problem, not just signal quality.
Small portfolio size. 11.0 stocks on average (vs 23+ for most other exchanges). Individual company effects matter much more in a concentrated portfolio. This explains the higher volatility in year-by-year returns.
Data quality filters reduce the universe. The combination of strict quality filters and data quality guards (oscillation removal, return filtering) narrows the UK universe significantly. This is a real limitation of applying the strategy to the LSE.
No local mid-cap benchmark. The FTSE 100 is a large-cap index. A FTSE 250 or FTSE All-Share benchmark would be more appropriate for a portfolio that includes mid-caps. The excess might shrink against a broader UK index.
Part of a Series
- Working Capital Efficiency in the US (flagship, full methodology)
- Working Capital Efficiency in Sweden (+6.5%/yr vs OMX30, best excess)
- Working Capital Efficiency in Canada (lowest drawdown, -21.0%)
- Working Capital Efficiency in India (+2.8%/yr vs Sensex)
- 14-Exchange Global Comparison
Data: Ceta Research (FMP financial data warehouse), LSE, 2000-2025. Returns in GBP, benchmarked against FTSE 100. Full methodology: METHODOLOGY.md
Past performance does not guarantee future results. This is educational content, not investment advice.


