small cap
Small-Cap Growth UK: Beats a Benchmark That Went Nowhere
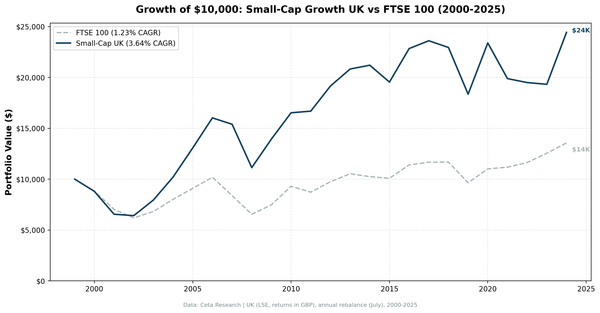
UK small-cap growth returned 3.64% CAGR and beat the FTSE 100 by 2.41 points a year. The FTSE 100 returned 1.23%, which is the only reason that was possible.

small cap
UK small-cap growth returned 3.64% CAGR and beat the FTSE 100 by 2.41 points a year. The FTSE 100 returned 1.23%, which is the only reason that was possible.
small cap
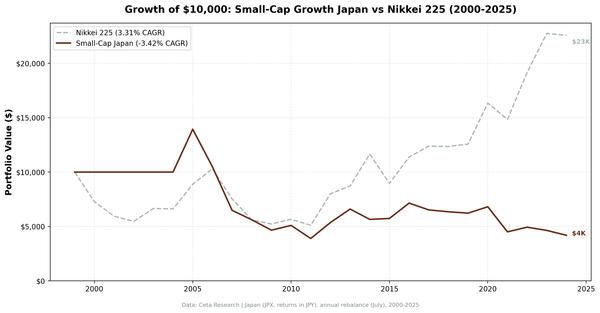
Japanese small-cap growth returned -3.42% CAGR over 25 years, turning $10,000 into $4,186. It trailed the Nikkei 225 by 6.73 points a year and has not beaten it since 2017.
small cap
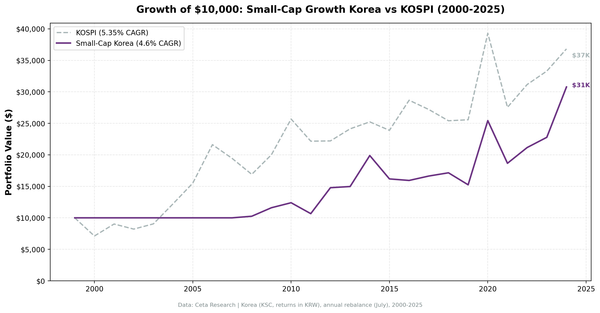
Korea's small-cap growth screen returned 4.60% CAGR against a KOSPI that did 5.35%. The entire deficit comes from eight opening years the screen could not fill.
small cap
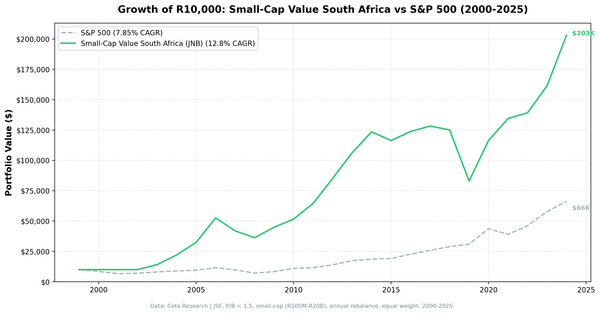
We backtested small-cap value on the Johannesburg Stock Exchange (JSE) from 2000 to 2025. 12.80% CAGR, +4.95% excess over SPY. Strong mid-2000s commodity boom returns, but the 0.163 Sharpe ratio reveals the cost of South Africa's high risk-free rate.
small cap
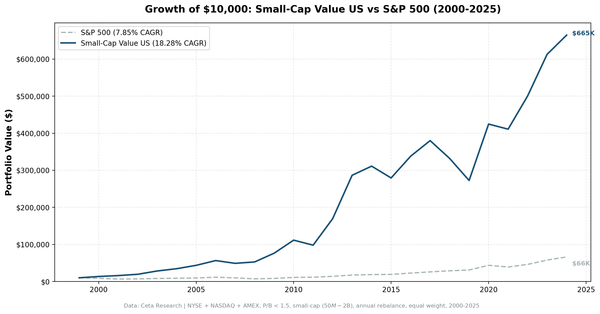
We backtested a small-cap value screen on US stocks from 2000 to 2025. Buy the 30 cheapest small caps by P/B with quality controls. Result: 18.10% CAGR vs 7.85% for SPY, with half the drawdown.
small cap
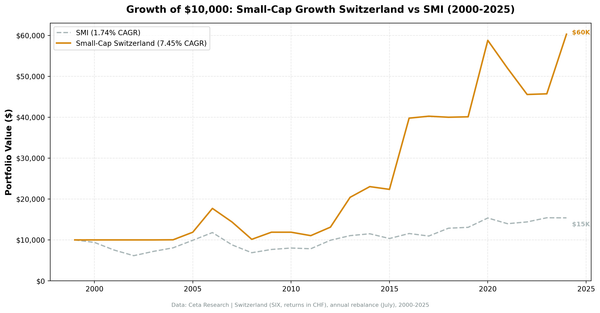
Switzerland's small-cap growth screen returned 7.45% CAGR against an SMI that did 1.74%, the best up-down capture in our study. It averaged 11.4 holdings and two years supplied most of the excess.
small cap
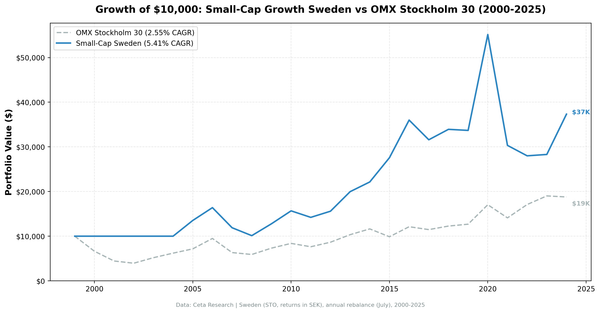
Sweden's small-cap growth screen returned 5.41% CAGR against an OMX Stockholm 30 that did 2.55%. Then 2021 gave back 27.7 points of relative performance in a single year.
small cap
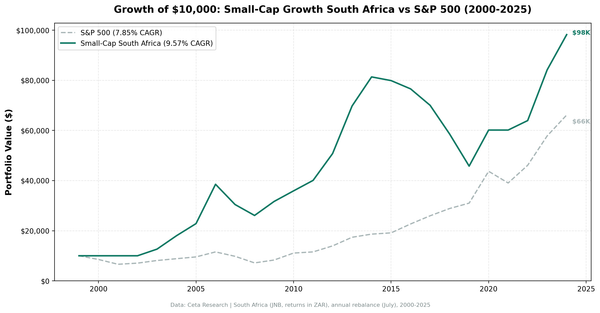
South African small-cap growth returned 9.57% CAGR over 25 years, the second-highest absolute return in our study. The excess was earned before 2010 and gave way to five straight losing years.
small cap
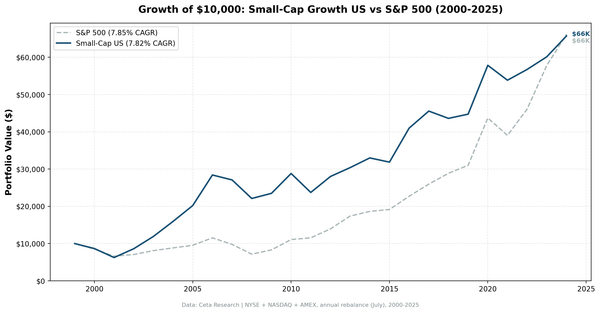
25 years of screening turned $10,000 into $65,721. The S&P 500 turned it into $66,167. And a third of the portfolio slots went to closed-end funds the screen mistook for growth companies.
small cap
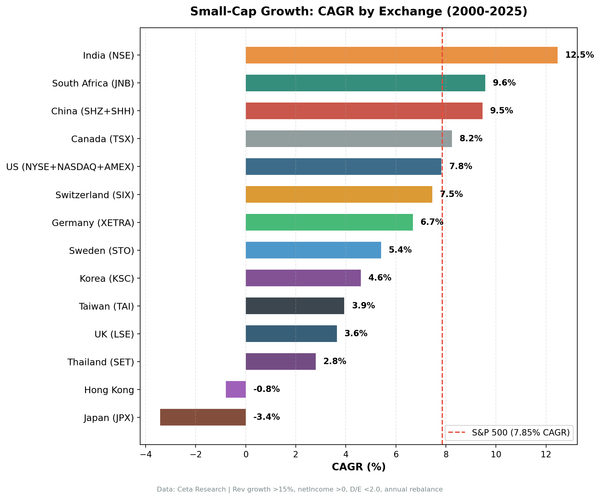
We tested one small-cap growth strategy across 14 exchanges over 25 years, each against its own index. It beat 8 of them. The catch: the biggest excess returns sit on top of indices that returned under 3% a year.
small cap
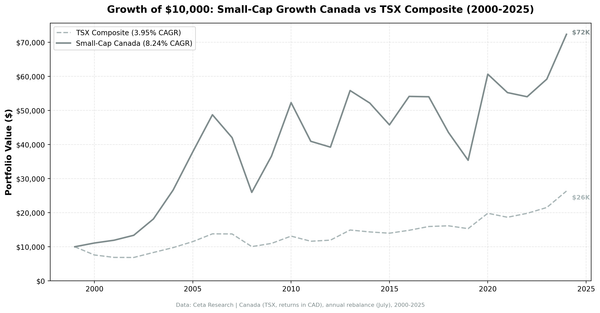
Canadian small-cap growth returned 8.24% CAGR over 25 years against a TSX Composite that did 3.95%. $10,000 became $72,383. Almost all of the edge was banked before 2010.
small cap
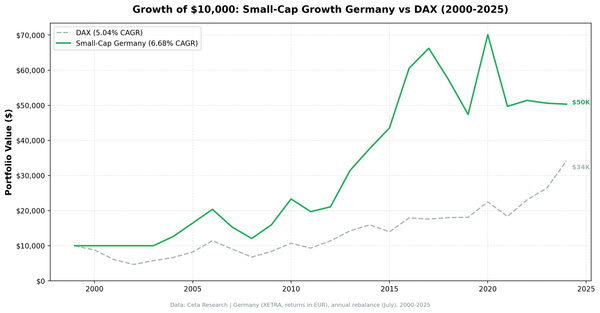
German small-cap growth returned 6.68% CAGR against a DAX that did 5.04%, with 42% down capture. Every point of the edge was earned before 2018.