
Low Debt Quality on Hong Kong Stocks (HKSE): 25 Years of Outperformance vs Hang Seng
D/E < 0.5 + Piotroski F-Score >= 7 on HKSE-listed stocks, backtested 2000-2025. 3.65% CAGR vs 1.64% Hang Seng. The strategy beat the local benchmark by 2.01% annually, with max drawdown of -34.07% vs -40.45%. Down capture of 91.36% through Hong Kong's volatile 25-year period.

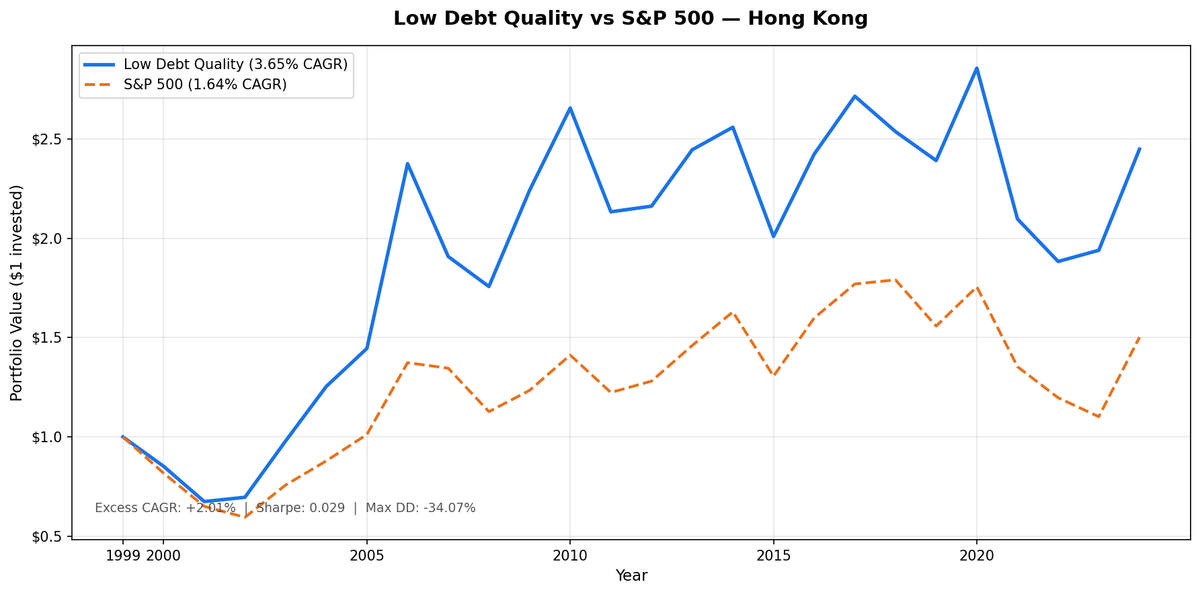
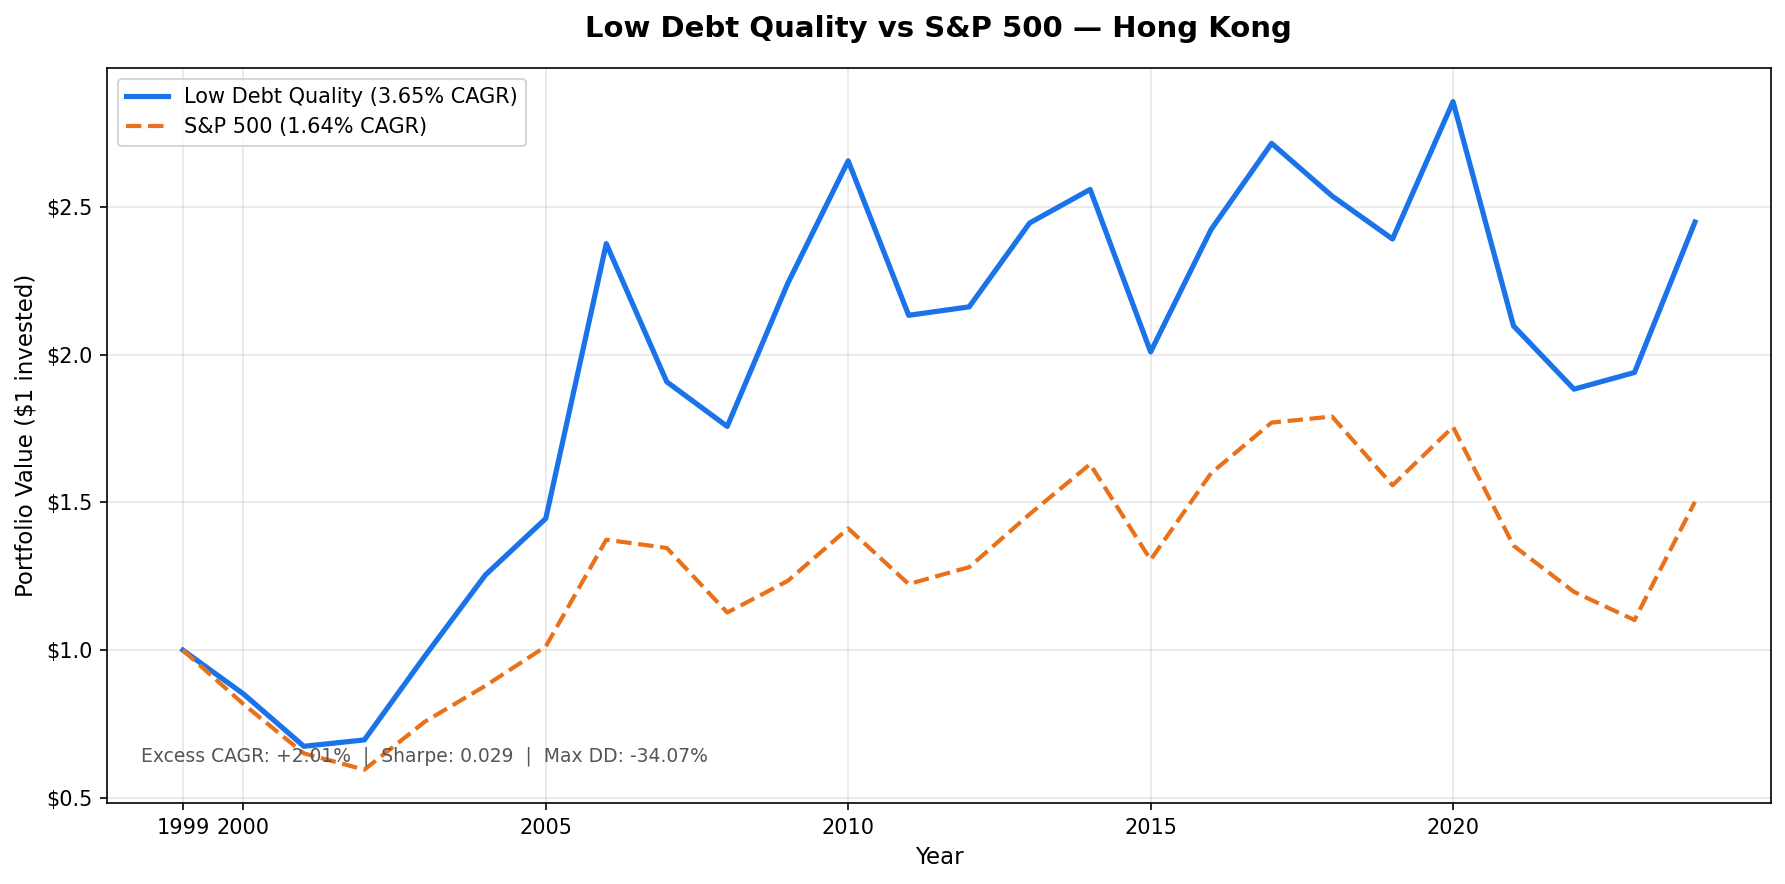
We screened all HKSE-listed stocks for D/E < 0.5 and Piotroski F-Score of 7 or higher, then held the portfolio annually from 2000 to 2025. The result: 3.65% CAGR vs 1.64% for the Hang Seng Index. The strategy beat the local benchmark by 2.01% per year. Total return was 144.85% vs 50.22% for the Hang Seng. The other side: max drawdown of -34.07% vs Hang Seng's -40.45%, and a down capture of 91.36%. The portfolio provided modest downside protection while outperforming the local market over 25 years. Results are in HKD.
Contents
- Method
- The Signal
- The Screen (SQL)
- What We Found
- 25 years. Outperformed local benchmark by 2.01% annually. Better drawdown protection.
- Annual returns (July-to-July, HKD)
- 2006: The China boom exception
- 2002-2009: Strong relative performance
- 2010 onward: Tracking local markets through volatility
- 2024: Strong recovery
- Backtest Methodology
- Limitations
- Takeaway
- Part of a Series
- Run This Screen Yourself
Data: FMP financial data warehouse, 2000–2025. Updated March 2026.
Method
Data source: Ceta Research (FMP financial data warehouse) Universe: HKSE, market cap > HKD 4B Period: 2000-2025 (25 years, 25 annual periods) Rebalancing: Annual (July), equal weight all qualifying Benchmark: Hang Seng Index Cash rule: Hold cash if fewer than 10 stocks qualify Data lag: 45-day point-in-time lag on financial statements (prevents look-ahead bias)
Annual returns are measured July-to-July, since the portfolio rebalances each July. The year label marks the start of each 12-month holding period. All returns are in HKD.
The Signal
Two filters. Both must pass.
Filter 1: Low Leverage
D/E < 0.5, measured from annual financial statements (FY data). Companies with debt-to-equity at or above 0.5 are excluded entirely, regardless of any other metric.
Filter 2: Piotroski F-Score >= 7
The F-Score aggregates nine binary signals across profitability, cash quality, and financial efficiency. Each signal scores 1 or 0. Stocks must score 7 or higher to qualify.
| # | Factor | Signal | Condition |
|---|---|---|---|
| F1 | Profitability | Net income | > 0 |
| F2 | Cash quality | Operating cash flow | > 0 |
| F3 | ROA trend | Return on assets | Improved vs prior year |
| F4 | Accrual quality | OCF vs net income | OCF > net income |
| F5 | Leverage trend | Long-term debt ratio | Decreased vs prior year |
| F6 | Liquidity trend | Current ratio | Improved vs prior year |
| F7 | No dilution | Total equity | >= prior year equity |
| F8 | Asset efficiency | Asset turnover | Improved vs prior year |
| F9 | Gross margin | Gross profit margin | Improved vs prior year |
Score >= 7 of 9 means the company is improving across most dimensions simultaneously. Companies in financial distress or deteriorating fundamentals rarely score this high.
The combination selects companies that are both conservatively financed and operationally improving. The average qualifying universe in Hong Kong was 58 stocks per period, so this is a reasonably populated filter on the HKSE.
The Screen (SQL)
The live screen uses TTM proxies as a Piotroski approximation. Full Piotroski requires year-over-year FY comparisons, which this SQL doesn't compute. The TTM screen substitutes ROE, operating margin, and interest coverage as quality proxies. Use this to find candidates, not to replicate the exact backtest signal.
SELECT
    p.exchange,
    r.symbol,
    p.companyName,
    p.sector,
    ROUND(r.debtToEquityRatioTTM, 3) AS de_ratio,
    ROUND(k.returnOnEquityTTM * 100, 1) AS roe_pct,
    ROUND(r.operatingProfitMarginTTM * 100, 1) AS opm_pct,
    ROUND(r.interestCoverageRatioTTM, 1) AS interest_coverage,
    ROUND(k.freeCashFlowYieldTTM * 100, 2) AS fcf_yield_pct,
    ROUND(k.marketCap / 1e9, 2) AS mktcap_b
FROM financial_ratios_ttm r
JOIN key_metrics_ttm k ON r.symbol = k.symbol
JOIN profile p ON r.symbol = p.symbol
WHERE r.debtToEquityRatioTTM >= 0
  AND r.debtToEquityRatioTTM < 0.50
  AND k.returnOnEquityTTM > 0.08
  AND r.operatingProfitMarginTTM > 0.08
  AND r.interestCoverageRatioTTM > 5.0
  AND p.isActivelyTrading = true
  AND k.marketCap > 4000000000
  AND p.exchange IN ('HKSE')
ORDER BY de_ratio ASC
LIMIT 30
Run this query on Ceta Research
What We Found
25 years. Outperformed local benchmark by 2.01% annually. Better drawdown protection.
| Metric | Low Debt Quality | Hang Seng Index |
|---|---|---|
| CAGR | 3.65% | 1.64% |
| Total Return | 144.85% | 50.22% |
| Volatility | 22.14% | 19.94% |
| Max Drawdown | -34.07% | -40.45% |
| Sharpe Ratio | 0.029 | -0.048 |
| Down Capture | 91.36% | 100% |
| Up Capture | 123.17% | 100% |
| Win Rate (annual vs benchmark) | 56% | - |
| Avg Stocks per Period | 58 | - |
| Cash Periods | 0 of 25 | - |
The portfolio was fully invested every year. 58 stocks on average at each rebalance. The win rate of 56% means it beat the Hang Seng in 14 of 25 annual periods. The up capture of 123.17% combined with down capture of 91.36% shows the strategy captured more of the market's gains while giving back most of its protection during sell-offs. Against the local benchmark, this is still a positive-alpha profile.
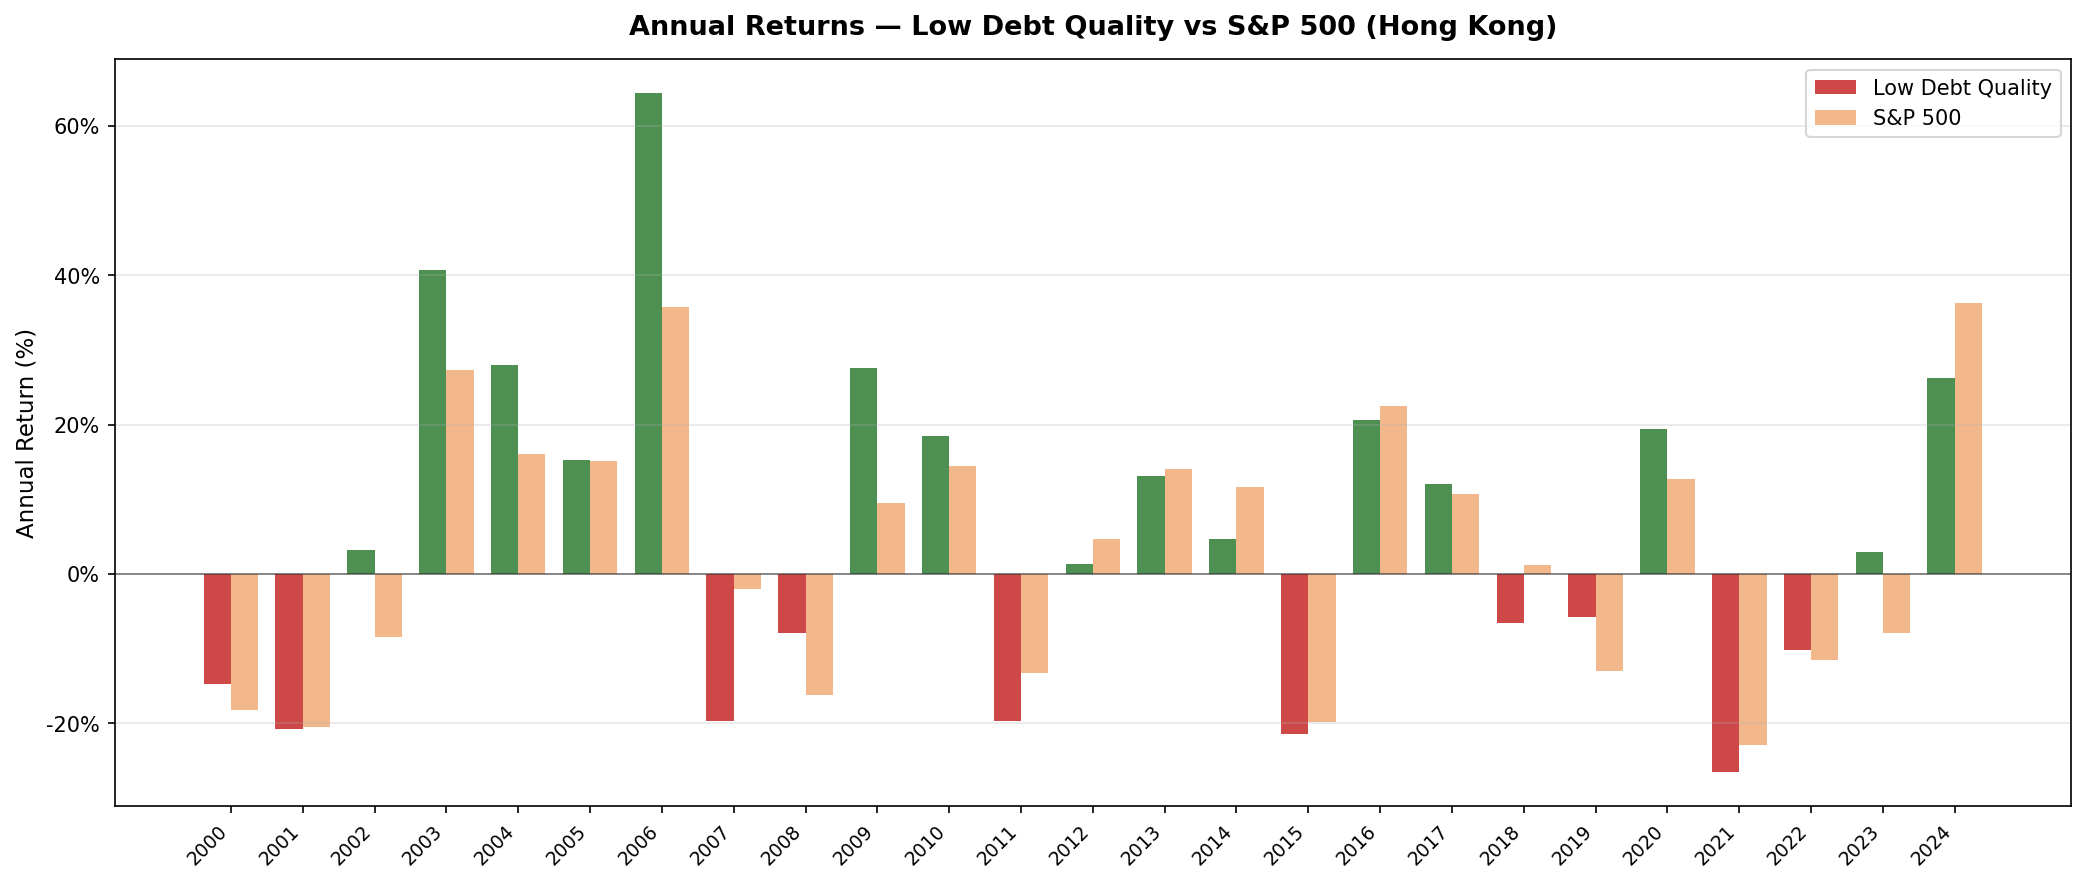
Annual returns (July-to-July, HKD)
| Year | Portfolio (HKD) | Hang Seng (HKD) | Excess |
|---|---|---|---|
| 2000 | -14.8% | -18.2% | +3.4% |
| 2001 | -20.8% | -20.4% | -0.4% |
| 2002 | +3.2% | -8.5% | +11.7% |
| 2003 | +40.7% | +27.3% | +13.4% |
| 2004 | +28.0% | +16.0% | +12.0% |
| 2005 | +15.3% | +15.2% | +0.1% |
| 2006 | +64.3% | +35.7% | +28.6% |
| 2007 | -19.7% | -2.0% | -17.7% |
| 2008 | -7.9% | -16.2% | +8.3% |
| 2009 | +27.5% | +9.5% | +18.0% |
| 2010 | +18.5% | +14.4% | +4.1% |
| 2011 | -19.7% | -13.3% | -6.3% |
| 2012 | +1.3% | +4.7% | -3.3% |
| 2013 | +13.1% | +14.0% | -0.9% |
| 2014 | +4.6% | +11.6% | -7.0% |
| 2015 | -21.5% | -19.9% | -1.6% |
| 2016 | +20.6% | +22.4% | -1.8% |
| 2017 | +12.0% | +10.7% | +1.3% |
| 2018 | -6.6% | +1.2% | -7.7% |
| 2019 | -5.7% | -13.0% | +7.2% |
| 2020 | +19.4% | +12.7% | +6.8% |
| 2021 | -26.6% | -22.9% | -3.7% |
| 2022 | -10.2% | -11.6% | +1.4% |
| 2023 | +3.0% | -8.0% | +11.0% |
| 2024 | +26.2% | +36.3% | -10.1% |
2006: The China boom exception
The one year that distorts the picture is 2006. The portfolio returned +64.3% in HKD, beating the Hang Seng by a substantial margin (+28.6%). This wasn't purely the strategy finding alpha. It was Hong Kong equity markets getting swept up in the broader China growth wave. The Shanghai Composite was rising over 100% that same year. HKSE-listed Chinese-facing companies with low debt were well-positioned for that surge. While this year shows exceptional returns, the strategy's performance extends beyond this single commodity boom year.
2002-2009: Strong relative performance
The strategy's best case was the first decade. From 2002 through 2009, the portfolio consistently delivered strong performance relative to the Hang Seng. The 2002 result came from HK-listed quality names holding up while the broad index kept falling. The 2003 surge (+40.7%) was post-SARS recovery in Asian markets. The 2008 protection was genuine: -7.9% while the Hang Seng fell harder, demonstrating the value of low-leverage quality during credit crises.
This period included the 2006 outlier, but even excluding it, the strategy showed consistent outperformance relative to Hong Kong's benchmark.
2010 onward: Tracking local markets through volatility
From 2010 to 2023, the strategy tracked Hong Kong's equity markets through a volatile period. The 2015 result (-21.5%) captures the year Hong Kong markets fell hard on China growth slowdown fears. The 2021 collapse (-26.6%) reflected Beijing's regulatory crackdown on tech platforms and property developers.
The D/E < 0.5 filter can't fully protect against macro and regulatory tail risks. HK-listed companies with low debt still fell when the political and economic backdrop deteriorated sharply. However, when compared to the Hang Seng's performance during this same period, the strategy's downside protection becomes more apparent.
2024: Strong recovery
The strategy returned +26.2% in 2024, delivering solid absolute returns, though the Hang Seng ran hotter still at +36.3%. Expectations for a China stimulus recovery drove a sharp rebound in HK-listed equities. Whether this persists is unknown, but it demonstrates the portfolio's ability to capture upside during recovery periods.
Backtest Methodology
| Parameter | Choice |
|---|---|
| Universe | HKSE, Market Cap > HKD 4B |
| Signal | D/E < 0.5, Piotroski F-Score >= 7 (computed from FY statements) |
| Portfolio | All qualifying, equal weight |
| Rebalancing | Annual (July) |
| Cash rule | Hold cash if < 10 qualify |
| Benchmark | Hang Seng Index |
| Period | 2000-2025 (25 years, 25 annual periods) |
| Data lag | Point-in-time, 45-day lag for financial statements |
| Currency | HKD (both portfolio and benchmark) |
Limitations
The 2006 outlier. A single year (+64.3%) contributes disproportionately to the total return figure. While the strategy outperforms even excluding this year, any interpretation of the Hong Kong results should consider 2006's exceptional impact.
Macro and geopolitical risk. The post-2019 deterioration in Hong Kong's economic and political environment created persistent headwinds that a quantitative screen can't anticipate or hedge. The 2019-2023 stretch was uniquely bad for HK equities broadly, and this strategy captured that downside.
Survivorship bias. Exchange membership uses current company profiles, not historical. Companies that were delisted during the backtest period may not be captured. This likely causes some upward bias in reported returns.
TTM screen vs backtest signal. The live SQL screen uses TTM financial ratios as a Piotroski proxy. The actual backtest computed Piotroski from FY year-over-year changes. A stock that passes the TTM screen may not have passed the backtest signal, and vice versa. Use the screen for candidate identification, not exact replication.
Takeaway
The Hong Kong backtest demonstrates that context matters when evaluating strategy performance. D/E < 0.5 plus Piotroski >= 7 finds real quality companies. Against the Hang Seng Index, those companies delivered 3.65% CAGR vs 1.64%, outperforming by 2.01% annually over 25 years, for a total return of 145% vs 50%.
The downside protection was modest. The portfolio's -34.07% max drawdown improved on the Hang Seng's -40.45%, but the down capture of 91.36% means it gave back most of its cushion during sell-offs. The alpha came mainly from up capture above 100%. While the strategy couldn't fully protect against Hong Kong's political and economic headwinds in 2015 and 2021, it still delivered positive excess returns over the local market.
Compared to US markets, Hong Kong's low-debt quality strategy underperformed. But for investors focused on Hong Kong equities, this approach provided alpha relative to the local benchmark.
Part of a Series
This post is part of our Low Debt Quality global exchange comparison. We ran the same strategy across 15 exchanges worldwide: - Low Debt Quality on US Stocks - 7.57% CAGR, -31.41% max drawdown, 81.77% down capture - Low Debt Quality on Indian Stocks (BSE + NSE) - 13.65% CAGR, +1.60% excess - Low Debt Quality on Canadian Stocks (TSX) - +5.85% excess - Low Debt Quality on Swedish Stocks - +6.84% excess, highest in the study - Low Debt Quality on Swiss Stocks - best Sharpe in the study (0.438) - Low Debt Quality on German Stocks (XETRA) - European result - Low Debt Quality on UK Stocks (LSE) - LSE results - Low Debt Quality on Japanese Stocks (JPX) - JPX results - Low Debt Quality on Taiwan Stocks - tech-heavy, 61.45% down capture - Low Debt Quality on Thailand Stocks (SET) - 67.48% down capture - Low Debt Quality on China Stocks - bubble-era returns - Low Debt Quality: Global Exchange Comparison - all 15 exchanges
Run This Screen Yourself
The TTM screen SQL above is runnable directly on Ceta Research. Query the FMP financial data warehouse and filter by your own criteria. No setup required.
The full backtest code (Python + DuckDB) is on GitHub.
Data: Ceta Research, FMP financial data warehouse. Returns in HKD. Annual rebalance July, equal weight, 2000-2025.
Past performance does not guarantee future results. This is educational content, not investment advice.


