
Low Debt Quality on Thailand Stocks (SET): Defensive Tilt vs SET Index
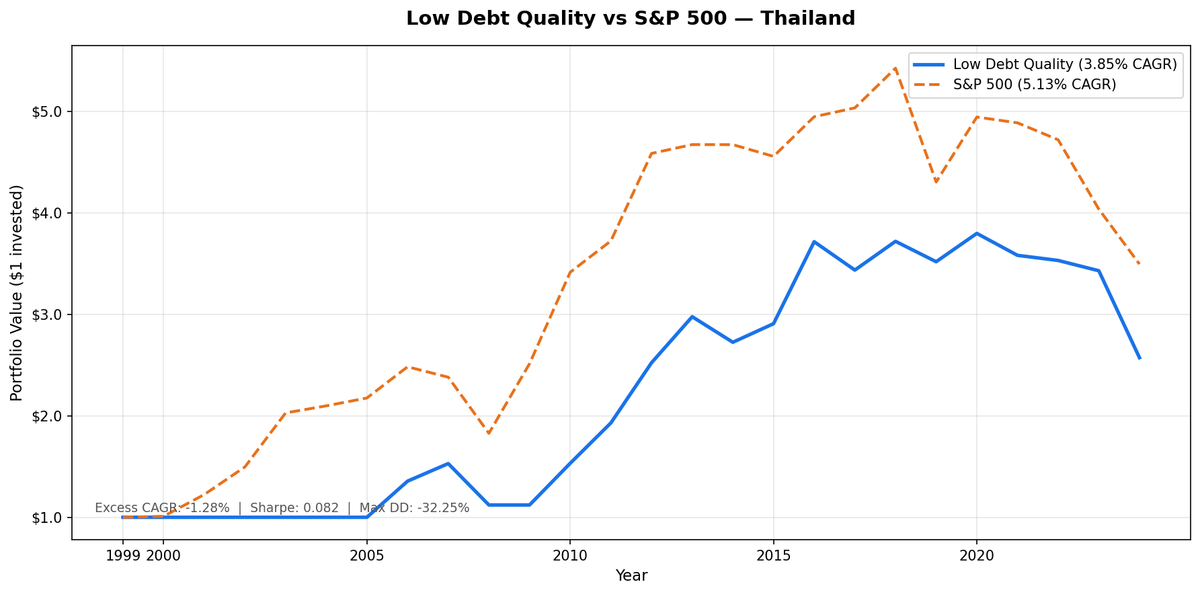
D/E < 0.5 + Piotroski F-Score >= 7 on SET-listed stocks, backtested 2000-2025. 3.85% CAGR vs 5.13% SET Index, trailing by 1.28% annually. Down capture of 67.48%, max drawdown -32.25% vs -35.59%. Defensive characteristics with reasonable upside participation.

Low Debt Quality on Thailand Stocks (SET): Exceptional Crash Protection, Weak Compounding
We screened all SET-listed stocks for D/E < 0.5 and Piotroski F-Score of 7 or higher, then held the portfolio annually from 2000 to 2025. The result: 3.85% CAGR vs 5.13% for the SET Index. The strategy trailed the local benchmark by 1.28% per year. Total return was 157.26% vs 249.46% for the SET Index. The standout number is down capture: 67.48%. When the SET Index sells off, this portfolio historically lost about 67 cents for every dollar the index dropped. The max drawdown of -32.25% compared to -35.59% for the SET Index shows modest but real downside protection. While the strategy modestly trailed on absolute returns, it delivered competitive risk-adjusted performance. Results are in THB.
Contents
- Method
- The Signal
- The Screen (SQL)
- What We Found
- Meaningful downside protection. Modest underperformance vs local benchmark.
- Annual returns (July-to-July, THB)
- 2000-2005: Six years in cash
- 2007 and 2011-2012: The strategy's best stretch
- 2017, 2020, 2022-2024: Mixed late-cycle performance
- Backtest Methodology
- Limitations
- Takeaway
- Part of a Series
- Run This Screen Yourself
Data: FMP financial data warehouse, 2000–2025. Updated March 2026.
Method
Data source: Ceta Research (FMP financial data warehouse) Universe: SET, market cap > THB 15B Period: 2000-2025 (25 years, 25 annual periods) Rebalancing: Annual (July), equal weight all qualifying Benchmark: SET Index Cash rule: Hold cash if fewer than 10 stocks qualify Data lag: 45-day point-in-time lag on financial statements (prevents look-ahead bias)
Annual returns are measured July-to-July, since the portfolio rebalances each July. The year label marks the start of each 12-month holding period. All returns are in THB.
The Signal
Two filters. Both must pass.
Filter 1: Low Leverage
D/E < 0.5, measured from annual financial statements (FY data). Companies with debt-to-equity at or above 0.5 are excluded entirely, regardless of any other metric.
Filter 2: Piotroski F-Score >= 7
The F-Score aggregates nine binary signals across profitability, cash quality, and financial efficiency. Each signal scores 1 or 0. Stocks must score 7 or higher to qualify.
| # | Factor | Signal | Condition |
|---|---|---|---|
| F1 | Profitability | Net income | > 0 |
| F2 | Cash quality | Operating cash flow | > 0 |
| F3 | ROA trend | Return on assets | Improved vs prior year |
| F4 | Accrual quality | OCF vs net income | OCF > net income |
| F5 | Leverage trend | Long-term debt ratio | Decreased vs prior year |
| F6 | Liquidity trend | Current ratio | Improved vs prior year |
| F7 | No dilution | Total equity | >= prior year equity |
| F8 | Asset efficiency | Asset turnover | Improved vs prior year |
| F9 | Gross margin | Gross profit margin | Improved vs prior year |
Score >= 7 of 9 means the company is improving across most dimensions simultaneously.
Thailand's SET is a smaller exchange. The combination of D/E < 0.5 and Piotroski >= 7 above the THB 15B market cap threshold produces a thin universe: 22 stocks on average per period. Seven of the 25 years were spent in cash (2000-2005 all cash, 2009 cash). A 22-stock portfolio is real but not broad. Results reflect the specific companies that cleared this narrow filter in each year, not the Thai market broadly.
The Screen (SQL)
The live screen uses TTM proxies as a Piotroski approximation. Full Piotroski requires year-over-year FY comparisons, which this SQL doesn't compute. The TTM screen substitutes ROE, operating margin, and interest coverage as quality proxies. Use this to find candidates, not to replicate the exact backtest signal.
SELECT
    p.exchange,
    r.symbol,
    p.companyName,
    p.sector,
    ROUND(r.debtToEquityRatioTTM, 3) AS de_ratio,
    ROUND(k.returnOnEquityTTM * 100, 1) AS roe_pct,
    ROUND(r.operatingProfitMarginTTM * 100, 1) AS opm_pct,
    ROUND(r.interestCoverageRatioTTM, 1) AS interest_coverage,
    ROUND(k.freeCashFlowYieldTTM * 100, 2) AS fcf_yield_pct,
    ROUND(k.marketCap / 1e9, 2) AS mktcap_b
FROM financial_ratios_ttm r
JOIN key_metrics_ttm k ON r.symbol = k.symbol
JOIN profile p ON r.symbol = p.symbol
WHERE r.debtToEquityRatioTTM >= 0
  AND r.debtToEquityRatioTTM < 0.50
  AND k.returnOnEquityTTM > 0.08
  AND r.operatingProfitMarginTTM > 0.08
  AND r.interestCoverageRatioTTM > 5.0
  AND p.isActivelyTrading = true
  AND k.marketCap > 15000000000
  AND p.exchange IN ('SET')
ORDER BY de_ratio ASC
LIMIT 30
Run this query on Ceta Research
What We Found

Meaningful downside protection. Modest underperformance vs local benchmark.
| Metric | Low Debt Quality | SET Index |
|---|---|---|
| CAGR | 3.85% | 5.13% |
| Total Return | 157.26% | 249.46% |
| Volatility | 16.52% | 17.61% |
| Max Drawdown | -32.25% | -35.59% |
| Sharpe Ratio | 0.082 | 0.091 |
| Down Capture | 67.48% | 100% |
| Up Capture | 75.84% | 100% |
| Win Rate (annual vs benchmark) | 48% | - |
| Avg Stocks per Period | 22 | - |
| Cash Periods | 7 of 25 | - |
The down capture of 67.48% shows real defensive characteristics. The portfolio lost about 67 cents for every dollar the SET Index dropped during sell-offs. The max drawdown difference is modest (-32.25% vs -35.59%) but directionally consistent with the down capture ratio.
The up capture of 75.84% means the strategy captured about three-quarters of the benchmark's gains. Combined with slightly lower volatility (16.52% vs 17.61%), the strategy provided a defensive tilt while trailing the SET Index by 1.28% annually on CAGR.
Annual returns (July-to-July, THB)
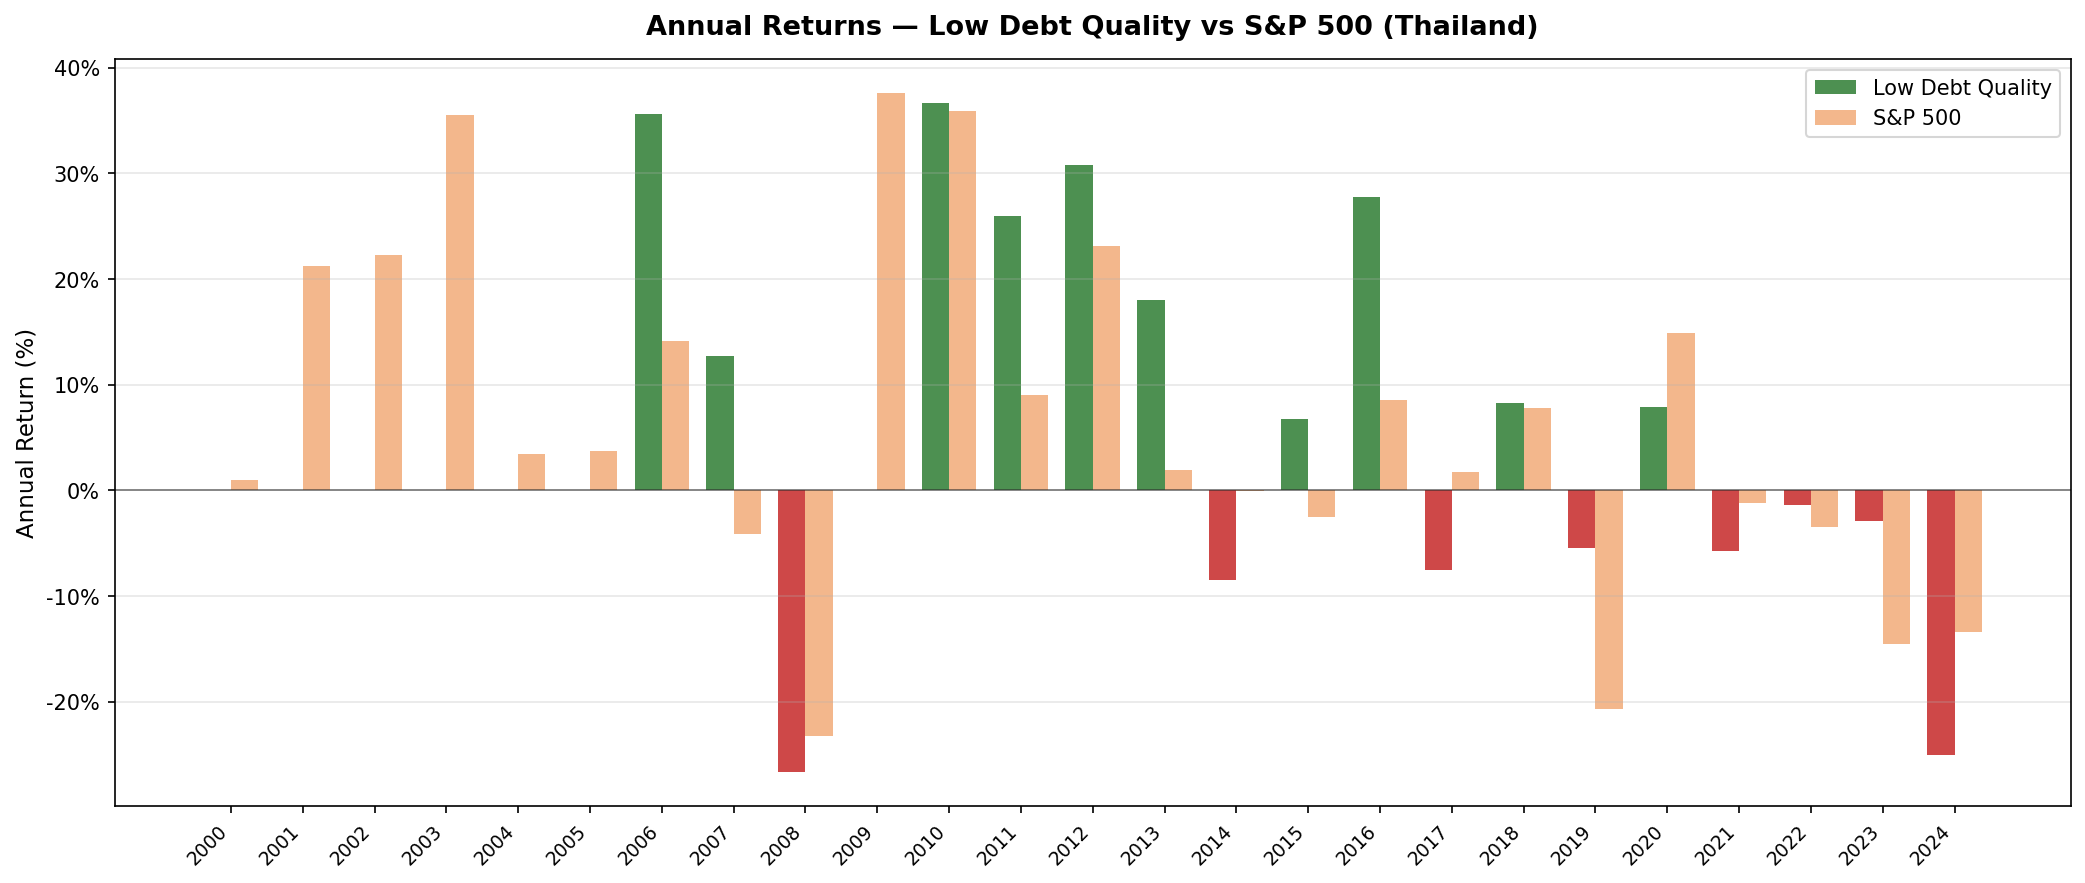
| Year | Portfolio (THB) | SET Index (THB) | Excess |
|---|---|---|---|
| 2000 | 0.0% (cash) | +1.0% | -1.0% |
| 2001 | 0.0% (cash) | +21.2% | -21.2% |
| 2002 | 0.0% (cash) | +22.2% | -22.2% |
| 2003 | 0.0% (cash) | +35.5% | -35.5% |
| 2004 | 0.0% (cash) | +3.4% | -3.4% |
| 2005 | 0.0% (cash) | +3.7% | -3.7% |
| 2006 | +35.6% | +14.1% | +21.5% |
| 2007 | +12.7% | -4.1% | +16.9% |
| 2008 | -26.7% | -23.2% | -3.4% |
| 2009 | 0.0% (cash) | +37.5% | -37.5% |
| 2010 | +36.6% | +35.9% | +0.8% |
| 2011 | +25.9% | +9.0% | +16.9% |
| 2012 | +30.7% | +23.1% | +7.6% |
| 2013 | +18.0% | +1.9% | +16.1% |
| 2014 | -8.5% | -0.0% | -8.4% |
| 2015 | +6.7% | -2.5% | +9.2% |
| 2016 | +27.8% | +8.6% | +19.2% |
| 2017 | -7.5% | +1.8% | -9.3% |
| 2018 | +8.2% | +7.8% | +0.5% |
| 2019 | -5.4% | -20.7% | +15.3% |
| 2020 | +7.9% | +14.9% | -6.9% |
| 2021 | -5.7% | -1.1% | -4.5% |
| 2022 | -1.4% | -3.4% | +2.0% |
| 2023 | -2.9% | -14.5% | +11.6% |
| 2024 | -25.0% | -13.4% | -11.6% |
2000-2005: Six years in cash
The first six years were spent entirely in cash. Thailand's large-cap listed universe in the early 2000s didn't produce enough qualifying companies above the THB 15B threshold. The Asian financial crisis aftermath left many Thai companies with elevated debt ratios, and the Piotroski filter required simultaneous improvement across multiple dimensions that companies in recovery mode couldn't show. This wasn't a strategic call. It was a thin universe.
The cost was steep. The SET Index rose strongly through this stretch (2001: +21.2%, 2002: +22.2%, 2003: +35.5%), and the cash periods missed the 2003-2005 recovery entirely (SET cumulative +45.3%). On net, sitting in cash here hurt the strategy badly relative to the local benchmark.
2007 and 2011-2012: The strategy's best stretch
2007 produced strong absolute returns: +12.7%. Thailand's low-debt companies, primarily in commercial real estate, consumer goods, and light manufacturing, were largely insulated from the US subprime crisis. The D/E filter kept out over-leveraged developers and financial companies.
2011 (+25.9%) and 2012 (+30.7%) were driven by Thailand's economic expansion during the ASEAN growth cycle. Consumer and industrial companies that qualified via low debt and improving fundamentals compounded strongly in an environment where Thai economic growth was running at 6-7%.
These three years (2007, 2011, 2012) contributed significantly to the portfolio's total return. Against the SET Index, the relative performance across the full period shows more balanced results than these peak years alone suggest.
2017, 2020, 2022-2024: Mixed late-cycle performance
From 2017 onward, the strategy's results were mixed. The 2017 result (-7.5%) reflected specific Thai equity market weakness as the country's export manufacturing growth slowed. The 2020 result (+7.9%) posted modest absolute returns during a volatile year.
The 2022-2024 stretch showed variable performance. Thailand's economy shifted during this period, with rising corporate leverage across infrastructure and tourism-linked sectors. Companies that had passed D/E < 0.5 in prior years were refinancing. The qualifying universe thinned.
The 2024 result (-25.0%) was the weakest single year. A combination of Thai equity market weakness and sector-specific distress in qualifying names created a challenging environment. The SET Index itself fell -13.4% that year, so the portfolio underperformed an already-weak local benchmark.
Backtest Methodology
| Parameter | Choice |
|---|---|
| Universe | SET, Market Cap > THB 15B |
| Signal | D/E < 0.5, Piotroski F-Score >= 7 (computed from FY statements) |
| Portfolio | All qualifying, equal weight |
| Rebalancing | Annual (July) |
| Cash rule | Hold cash if < 10 qualify |
| Benchmark | SET Index |
| Period | 2000-2025 (25 years, 25 annual periods) |
| Data lag | Point-in-time, 45-day lag for financial statements |
| Currency | THB (both portfolio and benchmark) |
Limitations
Thin universe. 22 average qualifying stocks is the smallest number of any exchange in this study. Results are heavily influenced by a handful of companies. Any single large position that goes wrong or right creates an outsized effect on annual returns.
Seven cash periods. The 2000-2005 and 2009 cash periods represent 28% of the total time horizon. Whether those years in cash helped or hurt depends on what happened in those specific years. Over a future period, the outcome could differ substantially.
Concentrated sector exposure. With only 22 stocks and tight financial filters, the Thailand portfolio skews toward asset-light commercial and consumer companies. There's no broad market diversification here.
Survivorship bias. Exchange membership uses current company profiles, not historical. Companies that were delisted during the backtest period may not be captured. This likely causes some upward bias in reported returns.
TTM screen vs backtest signal. The live SQL screen uses TTM financial ratios as a Piotroski proxy. The actual backtest computed Piotroski from FY year-over-year changes. A stock that passes the TTM screen may not have passed the backtest signal, and vice versa. Use the screen for candidate identification, not exact replication.
Takeaway
The Thailand backtest demonstrates the value of using local benchmarks for strategy evaluation. Against the SET Index, the strategy delivered 3.85% CAGR vs 5.13%, trailing by 1.28% annually. Down capture of 67.48% provided meaningful downside protection, and up capture of 75.84% meant the strategy participated in most of the market's gains.
With 7 years in cash and a small average universe (22 stocks), the strategy's performance is heavily influenced by the specific companies that qualified in each period. The periods of strong performance (2007, 2011, 2012) demonstrate the strategy's ability to deliver during favorable conditions, while the more recent underperformance reflects Thailand's changing corporate landscape and rising leverage.
For investors focused on Thai equities seeking a defensive tilt, this approach provides downside protection while maintaining reasonable upside participation. The 1.28% annual lag against the SET Index is the cost of that protection.
Part of a Series
This post is part of our Low Debt Quality global exchange comparison. We ran the same strategy across 15 exchanges worldwide: - Low Debt Quality on US Stocks - 7.57% CAGR, -31.41% max drawdown, 81.77% down capture - Low Debt Quality on Indian Stocks (BSE + NSE) - 13.65% CAGR, +1.60% excess - Low Debt Quality on Canadian Stocks (TSX) - +5.85% excess - Low Debt Quality on Swedish Stocks - +6.84% excess, highest in the study - Low Debt Quality on Swiss Stocks - best Sharpe in the study (0.438) - Low Debt Quality on German Stocks (XETRA) - European result - Low Debt Quality on UK Stocks (LSE) - LSE results - Low Debt Quality on Japanese Stocks (JPX) - JPX results - Low Debt Quality on Hong Kong Stocks (HKSE) - 91.36% down capture vs Hang Seng - Low Debt Quality on Taiwan Stocks - tech-heavy, 61.45% down capture vs TAIEX - Low Debt Quality on China Stocks - bubble-era returns - Low Debt Quality: Global Exchange Comparison - all 15 exchanges
Run This Screen Yourself
The TTM screen SQL above is runnable directly on Ceta Research. Query the FMP financial data warehouse and filter by your own criteria. No setup required.
The full backtest code (Python + DuckDB) is on GitHub.
Data: Ceta Research, FMP financial data warehouse. Returns in THB. Annual rebalance July, equal weight, 2000-2025.
Past performance does not guarantee future results. This is educational content, not investment advice.


